Louise Berry
SquaredUp

SquaredUp
Microsoft Teams is a ubiquitous presence in workplaces all over the world. Prior to 2020, its usage was relatively moderate, with around 20 million users. However, global restrictions during the pandemic led to a 3,500% growth. Teams is now so central to business operations that Microsoft retired Skype in its favor.
But this massive scale created a new problem – businesses needed better ways to monitor and report on their Teams usage.
An increased demand for various metrics and activities to track within the typical Teams environment spurred a number of existing reporting platforms to adapt their capabilities, with each offering different approaches to Teams analytics and monitoring. This blog will look at these various features and evaluate the strengths and weaknesses of each platform.
Before diving deep into each tool, here are our key findings to help guide your decision:
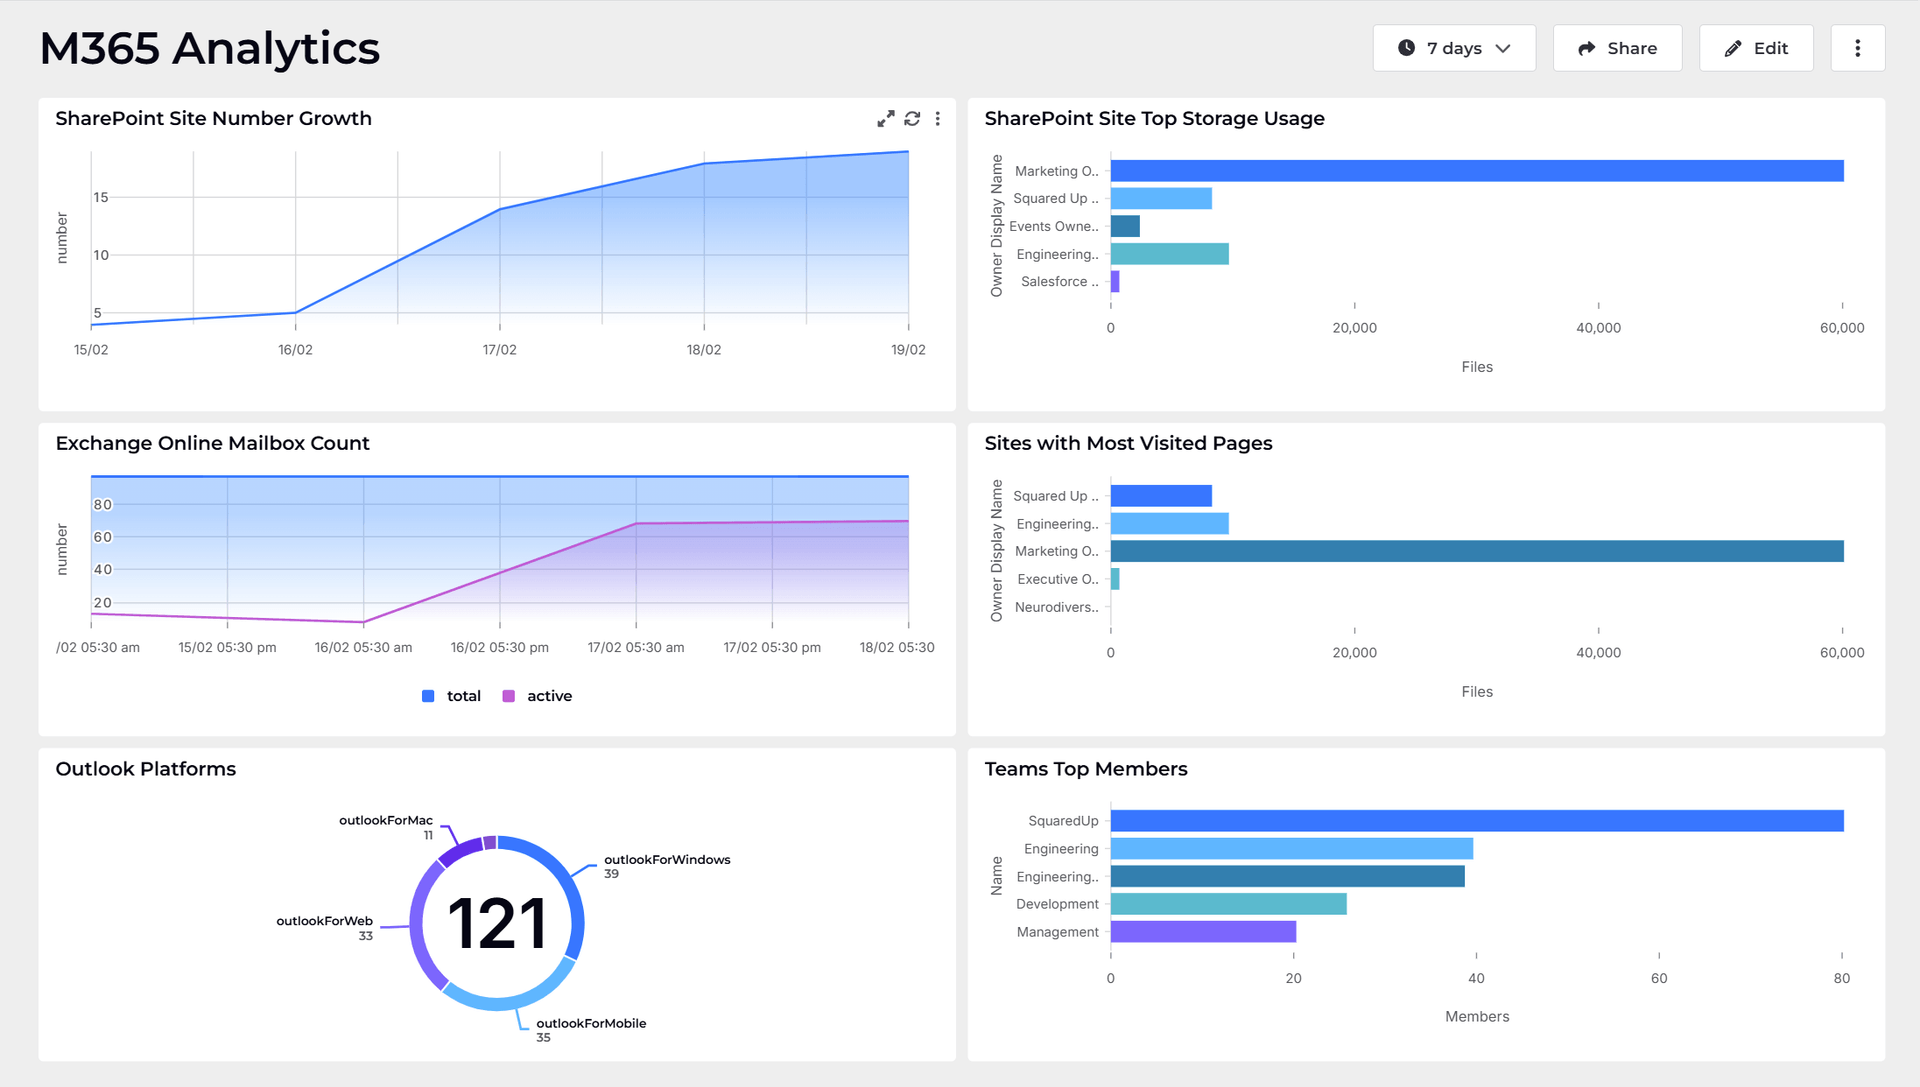
SquaredUp enables quick, customizable Microsoft Teams reporting by connecting directly to Microsoft 365 data. Users can build interactive dashboards to monitor Teams usage, compliance, and performance, with real-time updates and easy sharing. Dashboards can be embedded into Teams channels, supporting collaboration and timely insights without complex setup or data movement.
Power BI offers powerful analytics capabilities with extensive customization options, but requires significant expertise and a substantial amount of time to get set up. While feature-rich, its complexity can be overwhelming for teams seeking quick, actionable Teams insights.
Microsoft 365 Admin Center provides basic Teams usage reports built into your existing Microsoft ecosystem, but lacks the depth, customization, and real-time capabilities needed for comprehensive Teams management.
Teams reporting serves several critical organizational functions:
SquaredUp positions itself as a modern dashboarding solution that simplifies Microsoft 365 data visualization through an intuitive interface and real-time monitoring capabilities.

Direct M365 integration: Connects directly with the Microsoft 365 plugin enabling instant access to Teams and M365 data streams.
Pre-built dashboards: Includes ready-to-use templates for Teams reporting covering user activity, meeting statistics, call quality, and compliance metrics.
Real-time data access: Provides live data updates without delays, enabling immediate response to issues or changes.
Drag-and-drop interface: Allows users to create custom dashboards without coding knowledge through visual design tools.
Multi-source connectivity: Integrates with over 60 data sources beyond Microsoft 365, enabling comprehensive IT monitoring.
Sharing capabilities: Offers one-click dashboard sharing and embedding options for stakeholder distribution.
Scope focus: Primarily designed for IT and technical teams rather than business-wide analytics needs.
Data dependency: Relies entirely on source system data quality and availability; cannot compensate for incomplete or missing data.
SquaredUp is most suitable for IT teams and administrators who need immediate visibility into Teams performance and usage without extensive technical setup. It works well for organizations prioritizing speed of implementation and ease of use over advanced analytical capabilities.
Power BI serves as Microsoft's flagship business intelligence platform, offering comprehensive analytics and visualization capabilities for Teams data and broader organizational metrics.

Advanced analytics: Provides statistical analysis, predictive modeling, and machine learning capabilities for deep data insights.
Extensive customization: Offers unlimited visualization options, custom calculations, and tailored reporting layouts.
Collaborative features: Enables shared workspaces, commenting, and embedded reports across Microsoft applications.
Scalability: Handles large datasets and supports thousands of concurrent users in enterprise environments.
Mobile accessibility: Provides dedicated mobile applications for accessing reports on various devices.
Complexity barrier: Requires significant expertise in data modeling, DAX formulas, and visualization design.
Implementation time: Developing comprehensive Teams reports typically takes weeks or month, depending on requirements.
Maintenance overhead: Requires ongoing development, optimization, and troubleshooting by skilled personnel.
Learning curve: Users need substantial training to effectively create and interpret reports.
Cost scaling: Licensing costs can become significant for large organizations with many report consumers.
Performance considerations: Complex reports may experience slower load times and resource consumption.
Power BI is ideal for organizations with dedicated business intelligence teams, complex analytical requirements, and the resources to invest in comprehensive development and maintenance. It suits enterprises needing cross-platform analytics, combining Teams data with other business systems.
Microsoft 365 Admin Center provides native Teams reporting functionality integrated directly into the Microsoft administrative interface, offering basic usage and compliance insights.

Built-in availability: Accessible immediately within existing Microsoft 365 subscriptions without additional tools.
Core metrics coverage: Provides fundamental Teams usage statistics including active users, meeting participation, and device usage.
Compliance integration: Includes audit logs, policy compliance reports, and governance tracking capabilities.
Familiar interface: Uses consistent Microsoft administrative interface that IT teams already know.
No additional cost: Included with Microsoft 365 licensing without separate subscription fees.
Export capabilities: Allows data export to Excel for further analysis or record-keeping.
Historical restrictions: Reports typically limited to 30-180 days of historical data, restricting long-term trend analysis.
Limited customization: Provides only pre-defined report formats with minimal modification options.
Data delays: Reports often show information that is hours or days old rather than real-time data.
Basic visualizations: Offers simple charts and graphs without advanced visualization capabilities.
Scalability issues: Performance degrades in large environments with significant user bases.
No alerting: Lacks proactive notification capabilities for critical events or threshold breaches.
Microsoft 365 Admin Center works best for small to medium organizations with basic reporting needs, limited budgets, and simple compliance requirements. It suits environments where sophisticated analytics are not required and basic usage statistics are sufficient.
The optimal choice depends on your organization's specific requirements, technical capabilities, and resource availability:
For rapid implementation and IT-focused insights: SquaredUp offers the fastest path to comprehensive Teams reporting with minimal technical overhead.
For advanced analytics and cross-platform integration: Power BI provides the most sophisticated analytical capabilities for organizations with dedicated BI resources.
For basic monitoring and cost-conscious environments: Microsoft 365 Admin Center delivers essential reporting functionality without additional investment.
Feature | Squaredup | Power BI | Microsoft 365 Admin Center |
|---|---|---|---|
Implementation time | ✅ Under 5 minutes | ⚠️ Weeks to months | ✅ Immediate |
Technical expertise required | ✅ Minimal | ❌ High | ✅ Low |
Real-time data | ✅ Yes | ⚠️ Configurable | ❌ No |
Customization level | ✅ High with intuitive interface | ⚠️ Unlimited but complex | ❌ Minimal |
Teams-specific templates | ✅ Pre-built available | ❌ Custom development required | ⚠️ Basic reports only |
Cost | ✅ Transparent pricing, free tier | ❌ Can be expensive at scale | ✅ Included with M365 |
Data sources | ✅ 60+ integrations | ✅ Extensive connectivity | ❌ M365 services only |
Maintenance requirements | ✅ Minimal | ❌ High | ✅ None |
Advanced analytics | ⚠️ Suitable for most needs | ✅ Comprehensive | ❌ None |
Mobile access | ✅ Responsive dashboards | ✅ Native apps | ❌ Limited |
Learning curve | ✅ Quick to master | ❌ Steep | ✅ Familiar interface |
Deployment complexity | ✅ Minimal setup | ❌ Complex configuration | ✅ Ready to use |
In most use cases, SquaredUp emerges as the preferred choice for a powerful, scalable MS Teams reporting dashboarding tool. Here's why:
Implementation efficiency: SquaredUp's five-minute setup time compared to Power BI's weeks-long development cycle provides immediate value. Organizations can begin extracting insights from Teams data on day one rather than waiting for complex implementations. (You can read more about setting up this type of dashboard here)
Optimal complexity balance: While Power BI offers more analytical depth, most Teams reporting requirements don't necessitate advanced statistical modeling. SquaredUp provides sufficient analytical capability for typical IT monitoring and management needs without overwhelming complexity.
Cost-effectiveness: The transparent pricing structure and available free tier make SquaredUp more accessible than Power BI's per-user licensing model, especially for organizations primarily needing IT-focused reporting rather than enterprise-wide business intelligence. Find more details about this free tier here.
Purpose-built functionality: Unlike generic BI tools, SquaredUp was specifically designed for IT teams managing technology platforms. This focus translates into features and workflows that align naturally with Teams administration requirements.
Maintenance simplicity: The minimal maintenance requirements compared to Power BI's ongoing development needs make SquaredUp more sustainable for organizations without dedicated BI teams.
Real-time capabilities: The live data access provides immediate visibility into Teams performance and issues, enabling proactive management that delayed reporting cannot support.
SquaredUp represents the practical middle ground between Admin Center's limitations and Power BI's complexity, delivering comprehensive Teams reporting capabilities that match most organizational requirements while remaining accessible to typical IT teams.
SquaredUp’s smarter dashboards help engineering, product, and IT teams make better decisions through a deeper understanding of their data. Visualize and monitor any data from any tool, all in one place. Sign up for free now!
SquaredUp


Getting started with SquaredUp is free and easy. Our free tier includes: