Sameer Mhaisekar
DevRel Engineer, SquaredUp & Microsoft MVP
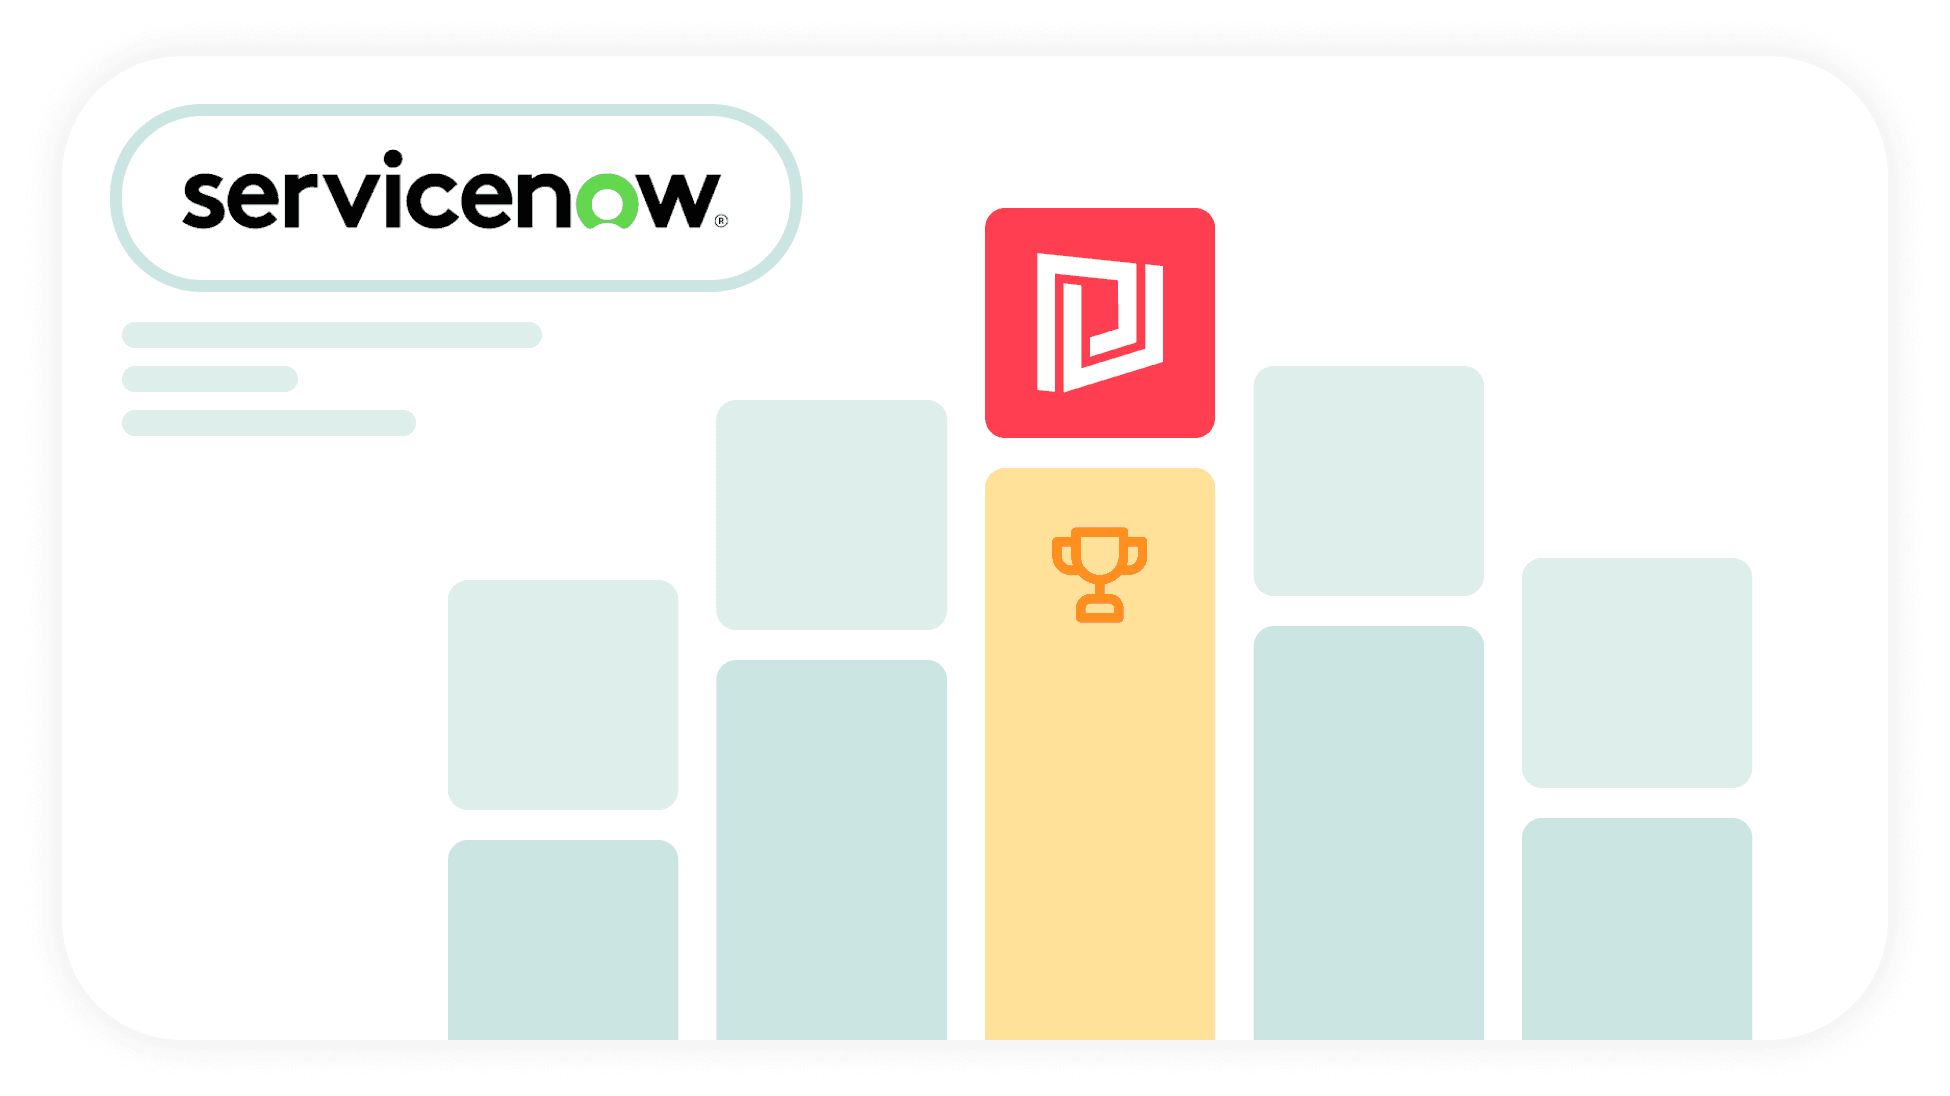
Comparing top 4 best ServiceNow dashboarding tools against SquaredUp
ServiceNow holds a wealth of operational data—but turning that data into dashboards people actually use is a different challenge altogether. Most teams start with what’s available out of the box. Then come the requests:
At that point, dashboarding stops being simple. It then has to be “augmented” - with easy shareability, ease of use, contextualization and hierarchy. This article compares five common approaches to ServiceNow dashboards - looking at what they do well, where they fall short, and which one makes sense if your goal is fast, effective dashboarding without unnecessary complexity.
SquaredUp is purpose-built for dashboarding in environments like ServiceNow. Unlike BI tools, it connects directly to live data without requiring extraction or complex pipelines. The focus is simple: make dashboards fast to build, easy to share, and useful across teams.

Performance Analytics is ServiceNow’s native dashboarding and reporting solution. It sits directly within the platform, giving it immediate access to all ServiceNow data and making it the default starting point for most teams.
Performance Analytics is a solid foundation, but it quickly shows its limits. It works best for internal, platform-centric reporting, not for broader visibility or flexible dashboarding.
Power BI is a general-purpose business intelligence platform designed to analyze data from multiple sources. When used with ServiceNow, it requires exporting or syncing data into Power BI before dashboards can be built.
Power BI is ideal for cross-business analytics and reporting, but not for quick wins. It’s powerful—but getting there takes time, setup, and ongoing effort.
Tableau is another leading BI platform, known for its visual quality and analytical depth. Like Power BI, it relies on extracting ServiceNow data into its own environment for reporting. It’s often used for executive dashboards and storytelling.
Tableau excels at polished, presentation-ready dashboards, but like Power BI, it’s not designed for speed. It’s a great reporting tool - not a sharable dashboarding solution.
Grafana is an open-source platform built for real-time monitoring and operational dashboards. With a ServiceNow plugin, it can pull data directly via API and display it in near real time.
Grafana is a strong choice for technical, real-time monitoring, but it requires effort and expertise. It’s not built for business users who need fast, accessible dashboards.
Here’s a quick comparison of all 5 tools across a range of parameters:
| Feature / Capability | ServiceNow Performance Analytics | PowerBI | Tableau | Grafana | SquaredUp |
| ServiceNow Integration | ✅ Native | ⚠️Connector / export | ✅ Via extract (JDBC) | ✅ API plugin | ✅ API plugin |
| Real-Time Data | ❌ Limited (scheduled updates) | ❌ Refresh-based | ❌ No (extract-based) | ✅ Near real-time | ✅ Near real-time |
| Ease of Setup | ✅ easy | ⚠️ Moderate | ⚠️ Moderate | ❌ Complex | ✅ Easy |
| Ease of Use | ⚠️ Basic | ⚠️ Moderate | ⚠️ Moderate | ❌ Advanced | ✅ User-friendly |
| Multi-Source Data | ❌ No | ✅ Yes | ✅ Yes | ✅ Yes | ✅ Yes |
| Ease of sharing | ❌ Limited | ✅ Easy | ✅ Easy | ⚠️ Possible | ✅ Built for sharing |
| Technical Skill Required | ⚠️ Low–Moderate | ⚠️ Moderate | ⚠️ Moderate | ⚠️ Moderate | ✅ Low |
| Time to Value | ✅ Fast | ❌ Slow | ❌ Slow | ⚠️ Moderate | ✅ Fastest |
SquaredUp strikes a balance that other tools miss. It delivers live, flexible dashboards without the overhead of BI tools or the limitations of native reporting - making it especially effective for teams that need results quickly.
Curious to try out yourself? Sign up for free and start building your ServiceNow dashboards today.
Happy dashboarding!
DevRel Engineer, SquaredUp & Microsoft MVP

Getting started with SquaredUp is free and easy. Our free tier includes: