John Hayes
Observability Advocate, SquaredUp
Engineering teams are shipping more AI-generated code than ever, but at what cost? Learn how to build a telemetry pipeline to monitor Claude Code usage and costs directly in SquaredUp.
Engineering teams are shipping more AI-generated code than ever, but at what cost? Learn how to build a telemetry pipeline to monitor Claude Code usage and costs directly in SquaredUp.
It is estimated that 85-90% of engineering teams are now using AI coding assistants such as Claude, Codex and Cursor. This is not just for small-scale pilot projects— around 40% of all code now being shipped is AI-generated, and in start-ups the figure is around 95%.
This can result in incredible productivity gains. At the same time though, there are downsides. Assistants misunderstand instructions, make unnecessary edits, make independent architectural decisions and burn through tokens.
Given the costs involved and the potential for delivering poorly engineered code, observability of coding assistants is now essential for engineering teams. Luckily, tools such as Claude emit telemetry capturing rich and granular detail around costs, token consumption, prompts and tool usage.
In this article, we will look at how you can:
We are going to look at capturing Claude Code telemetry, but the principles also apply to using other coding assistants such as OpenAI’s Codex. We will be sending our telemetry to the Azure cloud — again, though, this can easily be swapped out for another observability backend. At the moment, there is no official support for OpenTelemetry in Azure Log Analytics, so we will be using the recommended option of sending our telemetry to an Application Insights instance. The image below shows the stages in our telemetry flow:

There are obviously a few different options for using Claude — the Claude Code CLI, Claude Desktop, Teams etc. Whichever flavour you are using, the configuration options you define will be largely the same.
The first thing we need to do is define configuration settings in our Claude settings.json file. In an enterprise setting you will want to define these in the Teams administration console and roll out the settings centrally. There are a few interesting points to note. Firstly, emitting telemetry is not enabled by default— we need to explicitly switch it on. Equally, if you want to log prompts and tool usage, these also need to be explicitly enabled. For our environment, we are using the following settings:
"env":
{
"CLAUDE_CODE_ENABLE_TELEMETRY": "1", "CLAUDE_CODE_ENHANCED_TELEMETRY_BETA": "1",
"OTEL_METRICS_EXPORTER": "otlp",
"OTEL_LOGS_EXPORTER": "otlp",
"OTEL_TRACES_EXPORTER": "otlp",
"OTEL_EXPORTER_OTLP_PROTOCOL": "http/protobuf", "OTEL_EXPORTER_OTLP_ENDPOINT": "http://<your otel collector IP address/url> ",
"OTEL_LOG_USER_PROMPTS": "1",
"OTEL_LOG_TOOL_DETAILS": "1"
}
The key points here are:
You will need to restart your Claude instance for the settings to take effect.
Next, we need to configure our OpenTelemetry Collector. As we mentioned, we will be exporting telemetry from our OpenTelemetry Collector to an Application Insights endpoint. When configuring the destination in your Collector, you need to enter the full Application Insights connection string:
"InstrumentationKey=...;IngestionEndpoint=https://...applicationinsights.azure.com/"
When you are creating an OpenTelemetry collector there are an enormous number of possible configuration options. In this article we can only cover the most important options to get you up and running. Firstly, we need to specify that we are using theopenTelemetry-collector-contrib distribution as this ships with the AzureMonitor exporter:
image:
repository: otel/opentelemetry-collector-contrib
We are running our collector in an Azure Kubernetes instance and have saved our Application Insights connection string as a Kubernetes secret. Here, we are defining the secret as an Env variable so that we can use $Env semantics to reference it later on:
extraEnvs:
name: APPLICATIONINSIGHTS_CONNECTION_STRING
valueFrom:
secretKeyRef:
name: appinsights-connection key: connection-string
Next, we need to define our Azure Monitor exporter:
exporters:
azuremonitor:
connection_string: ${env:APPLICATIONINSIGHTS_CONNECTION_STRING}
And now we define the pipelines for each of our signals:
service:
extensions: [bearertokenauth, health_check]
pipelines:
traces:
receivers: [otlp]
processors: [memory_limiter, resource, batch]
exporters: [azuremonitor]
metrics:
receivers: [otlp]
processors: [memory_limiter, resource, cumulativetodelta, batch]
exporters: [azuremonitor]
logs:
receivers: [otlp]
processors: [memory_limiter, resource, batch]
exporters: [azuremonitor]
This will now send Claude Code telemetry to the Azure Log Analytics Workspace attached to our Application Insights instance. That is all of our setup complete — now we can query and visualise our telemetry in SquaredUp.
As we said earlier, Claude emits Logs, Metrics and Traces. Each signal is sent to a specific table in Azure Log Analytics — although the tables are not necessarily intuitively named— so here is a quick mapping:

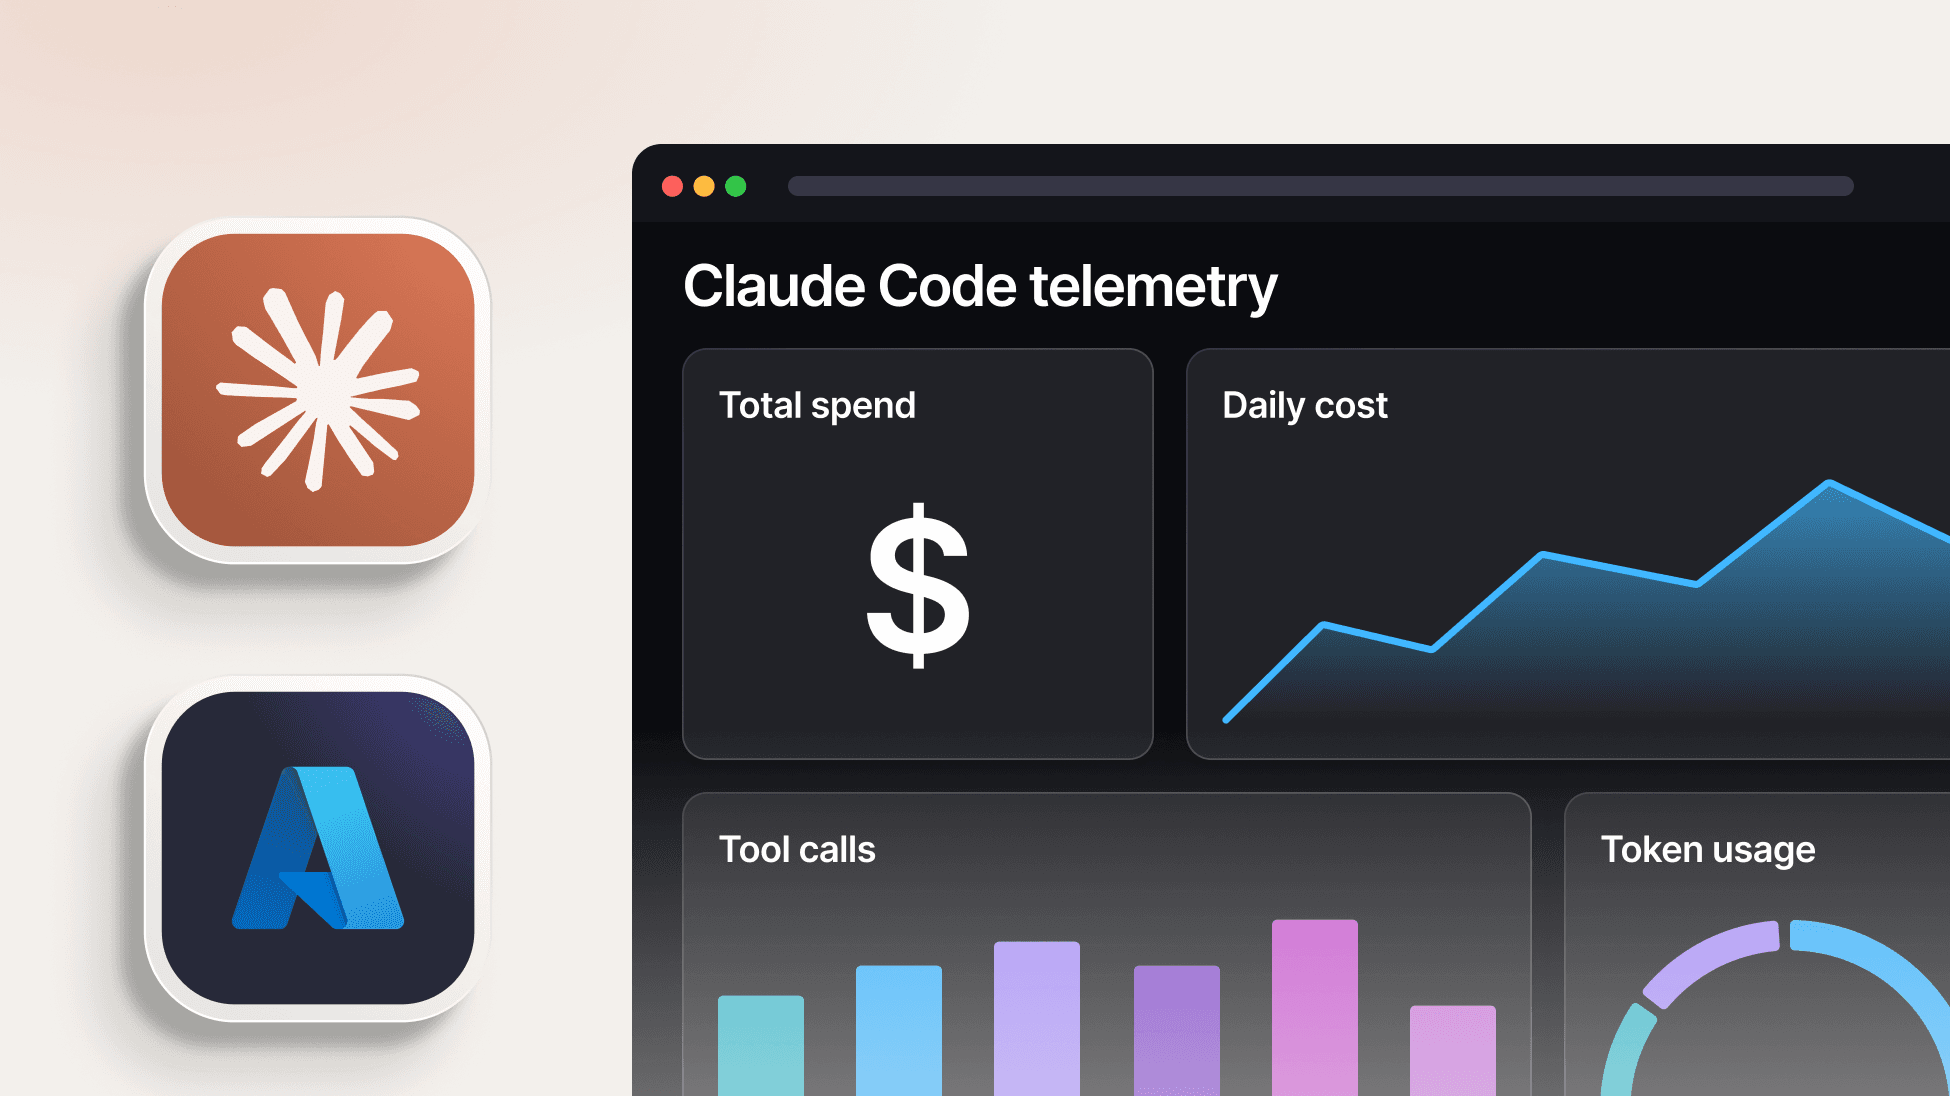
In SquaredUp, create a new dashboard and select the Azure data source. Next select the Log Analytics KQL Query (by workspace) data stream:

Then, in the Select objects step, select your Azure Analytics Workspace:

Next, we can enter our KQL query. The KQL Query Editor ships with SquaredUp’s SmartAssist feature— this is a context-aware AI assistant that can generate KQL from natural language.
If you are using a metred service such as Claude, two of your major concerns will be monetary cost and token usage. So let us run some queries for those:

And then we can select a Scalar visualisation to give the cost figure prominence at the top of our dashboard:

To display the total token usage, we follow a similar process, but we have used the following query:
AppMetrics
| where TimeGenerated > ago(7d)
| where Name == "claude_code.token.usage"
| extend TokenType = tostring(Properties["type"])
| summarize Tokens = sum(Sum) by TokenType
| union ( AppMetrics
| where TimeGenerated > ago(7d)
| where Name == "claude_code.token.usage"
| summarize Tokens = sum(Sum)
| extend TokenType = "TOTAL" )
| order by Tokens desc
This query gives us a total of all the tokens we have used. This is a good start. However, we would like to be a bit more granular and exclude read tokens. This is because read tokens are relatively cheap and write tokens will make up the overwhelming bulk of our expenditure. To give us flexibility we are going to define this filter in SquaredUp:

Engineering teams will not only want to track costs. They will also want to see which tools are being used — this could either be for governance purposes or simply to understand how engineers are working within and across teams. To query this, we can just use the tool_result event in the AppTraces table:
AppTraces
| where Properties["event.name"] == "tool_result"
| extend Tool = tostring(Properties["tool_name"]), Success = tobool(Properties["success"]), Duration = todouble(Properties["duration_ms"])
| summarize Calls = count(), SuccessRate = avg(toint(Success)) * 100, AvgDurationMs = avg(Duration) by Tool
| order by Calls desc
And we can display the results using a Donut chart:

Skills have emerged as one of the most important mechanisms for managing interactions with coding agents. They are reusable text files which give precise instructions to ensure reliable and repeatable outcomes. Since they are not explicitly invoked, you may want to track that the skills defined by your team are actually being used by your agents. We can track this using the skills_activated event in the AppTraces table:
AppTraces
| where TimeGenerated > ago(7d)
| where tostring(Properties["event.name"]) == "skill_activated"
| extend SkillName = tostring(Properties["skill.name"])
where isnotempty(SkillName)
| summarize Activations = count() by SkillName
And now let’s visualise this with a bar chart:

GenAI observability is a large topic in a rapidly evolving space. As well as the architectural issues, there is also a rich set of metrics to analyse as well as subtleties and complexities in understanding and analysing the telemetry. In this article we have covered the basics of capturing telemetry, forwarding it to Azure and then running some common queries. In a follow-up article we will be taking our analytics to the next level, exploring advanced use-cases such as:
Stay tuned!
Observability Advocate, SquaredUp

Getting started with SquaredUp is free and easy. Our free tier includes: