John Hayes
Observability Advocate, SquaredUp
Connect Sentry’s rich telemetry to SquaredUp dashboards for actionable analytics across issues, events and releases.

Sentry is a mature observability product with SDKs supporting nearly every major programming language. It has expert knowledge of each coding stack and is therefore capable of offering rich insights with a minimum of initialisation required by the developer. You don’t need to set up OpenTelemetry collectors or wrestle with endpoint configurations; simply drop the SDK initialisation into your application start-up process and telemetry begins flowing into the Sentry backend.
Despite its ease of use, there is no lack of sophistication in the depth of analytics available within the platform. As well as providing extensive application diagnostics - it also integrates with source code providers and so can correlate issues with commits and releases to provide full context for analytics and debugging.
In this article we will use the SquaredUp Web API data source to connect to the Sentry API and visualise entities such as Issues, Events and Alerts.
Before we get started you will need to generate a Sentry API token. In your Sentry portal under Developer Settings, create a token with the necessary permissions for the endpoints you will query.
To set up the connection, just enter the URL of the Sentry API (https://sentry.io/api/0) and then add an Authorization header. The value for the Authorization header will be in the format:
Bearer <Your API Token>

To start off we will build a scalar tile that shows the current number of Sentry system alerts. Add a new tile and select the Web API data source. Then select the HTTP Request data stream (the only available stream for Web API) and click on Done.
In the Configure Parameters step, enter the following:
Request type: GET
Base URL: https://sentry.io/api/0
Path: /projects/<your‑organisation‑id>/<project‑name>/rules/
(For example: /projects/john‑hayes‑org/dotnet‑aspnetcore‑frontend/rules/)

In the Response tab, set the root object path to result.items.

Finally, select the Scalar visualisation type, so the tile displays a single metric – the current count of alerts.
Two of the most important concepts in Sentry are Issues and Events. Issues are a way of grouping together instances of a particular error. Events represent each specific instance of the error. So, if the same File Not Found error occurred 10 times, this would be represented as one Issue and 10 Events.
Issues in Sentry are surfaced at the organisation level, so the path we enter in our Configure parameters step is:/organizations/<your-organisation-id>/issues

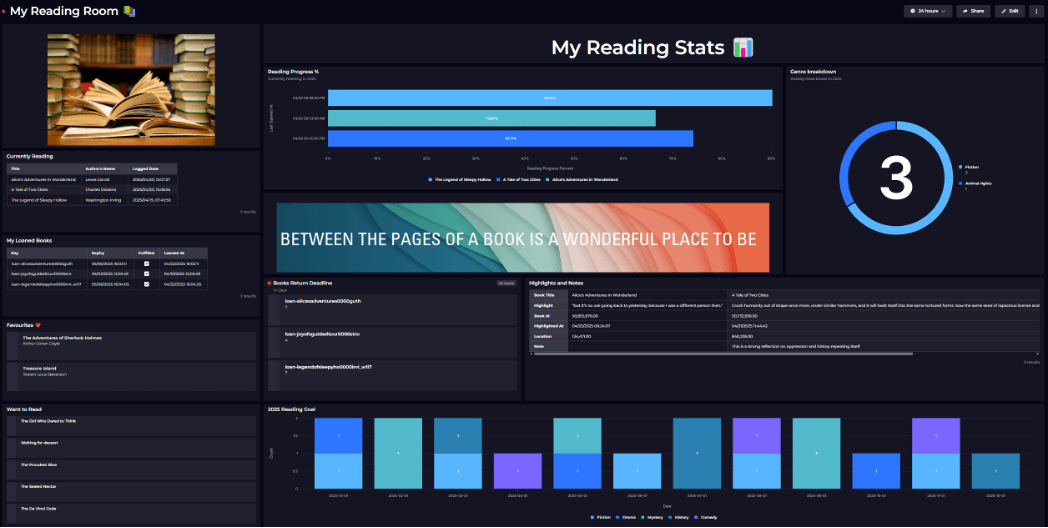
In our dashboard we have used a number of different SquaredUp visualisations for different perspectives on Sentry issues. We have used a line graph for viewing issues over time and a column chart to break issues down by type. As well as retrieving the Issue description, Sentry also returns the Culprit – i.e. the endpoint responsible for the error. In SquaredUp we can use the Group feature to easily summarise this data:

And then represent it as a Donut chart:

In Sentry, I can view Events for individual projects, but what I would like is a timeline view that combines data from multiple projects, as in the visualisation below:

With SquaredUp, we can accomplish this by using SQL Analytics – a feature that allows us to combine multiple datasets and then query them as if they were SQL tables. We will add a new tile as we have previously done and then retrieve data from the Events endpoint:

Then, we will add some pre-aggregation by grouping the events into daily buckets. This will make our eventual SQL query much simpler. We do this by adding a grouping on the Date Created field in the Filter | Group | Sort step:

This is the first dataset for our tile. As we have said, we need to combine multiple datasets so we just need to click on the Add dataset button and then repeat the process as often as required. Once we have retrieved the data for each individual project, we can aggregate the results with a SQL query like the one below:

The SQL Analytics feature offers incredible scope for combining, aggregating and filtering data from multiple different queries and is a great way to help you take your Sentry analytics to the next level.
By combining Sentry’s telemetry with SquaredUp’s flexible visualisation capabilities you can not only view application issues in their full context, you can also slice and dice data to meet the needs of stakeholders across your organisation. If you’d like to explore this yourself, sign up for the SquaredUp free‑forever plan and start leveraging over 60 supported data sources to visualise your organisation’s data.
Happy dashboarding!
Observability Advocate, SquaredUp


Getting started with SquaredUp is free and easy. Our free tier includes: