Dan Watts
DevRel Engineer, SquaredUp

Getting started with SquaredUp is free and easy. Our free tier includes:
Monitor Google Workspace user activity, admin actions, and security posture at a glance via SquaredUp's Web API plugin.
DevRel Engineer, SquaredUp
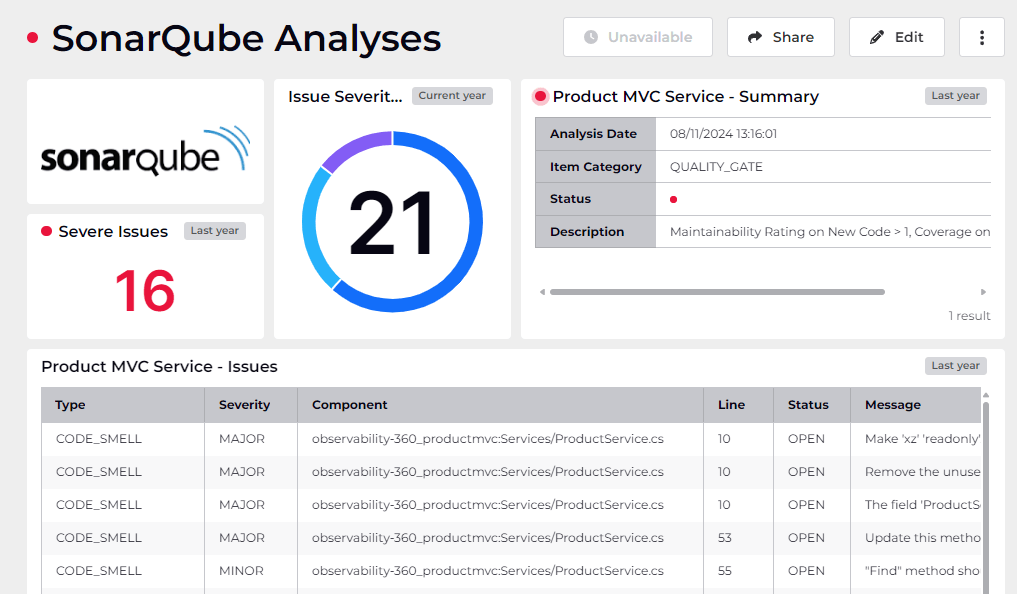
Forget sifting through endless tables and reports to understand your Google Workspace environment and users. SquaredUp dashboards transform raw data into dynamic, insightful visualizations, making it easy to monitor user activity, admin actions, and security posture at a glance. Let's explore how this dashboard brings Google Workspace data to life.


This dashboard leverages SquaredUp's Web API plugin to pull data directly from the large suite of Google Workspace APIs. This means real-time updates and the flexibility to customize the metrics you track. It would also be possible adding tiles to monitor:
SquaredUp doesn't just present data; it tells a story. By combining clear visuals with relevant metrics, this dashboard provides a comprehensive overview of your Google Workspace environment. This empowers you to:
SquaredUp dashboards transform the way you interact with Google Workspace data. With its powerful visualization capabilities and flexible Web API integration, you can create dynamic, insightful dashboards that keep you informed and in control of your environment.
Identity and users is just one example of how SquaredUp can be used to visualize Google Workspace data. With a bit of creativity and the right tools, the possibilities are endless!