Get started in seconds
Getting started with SquaredUp is free and easy. Our free tier includes:
- 2 users
- 3 data sources
- 10 monitors
- Unlimited dashboards
Getting started with SquaredUp is free and easy. Our free tier includes:
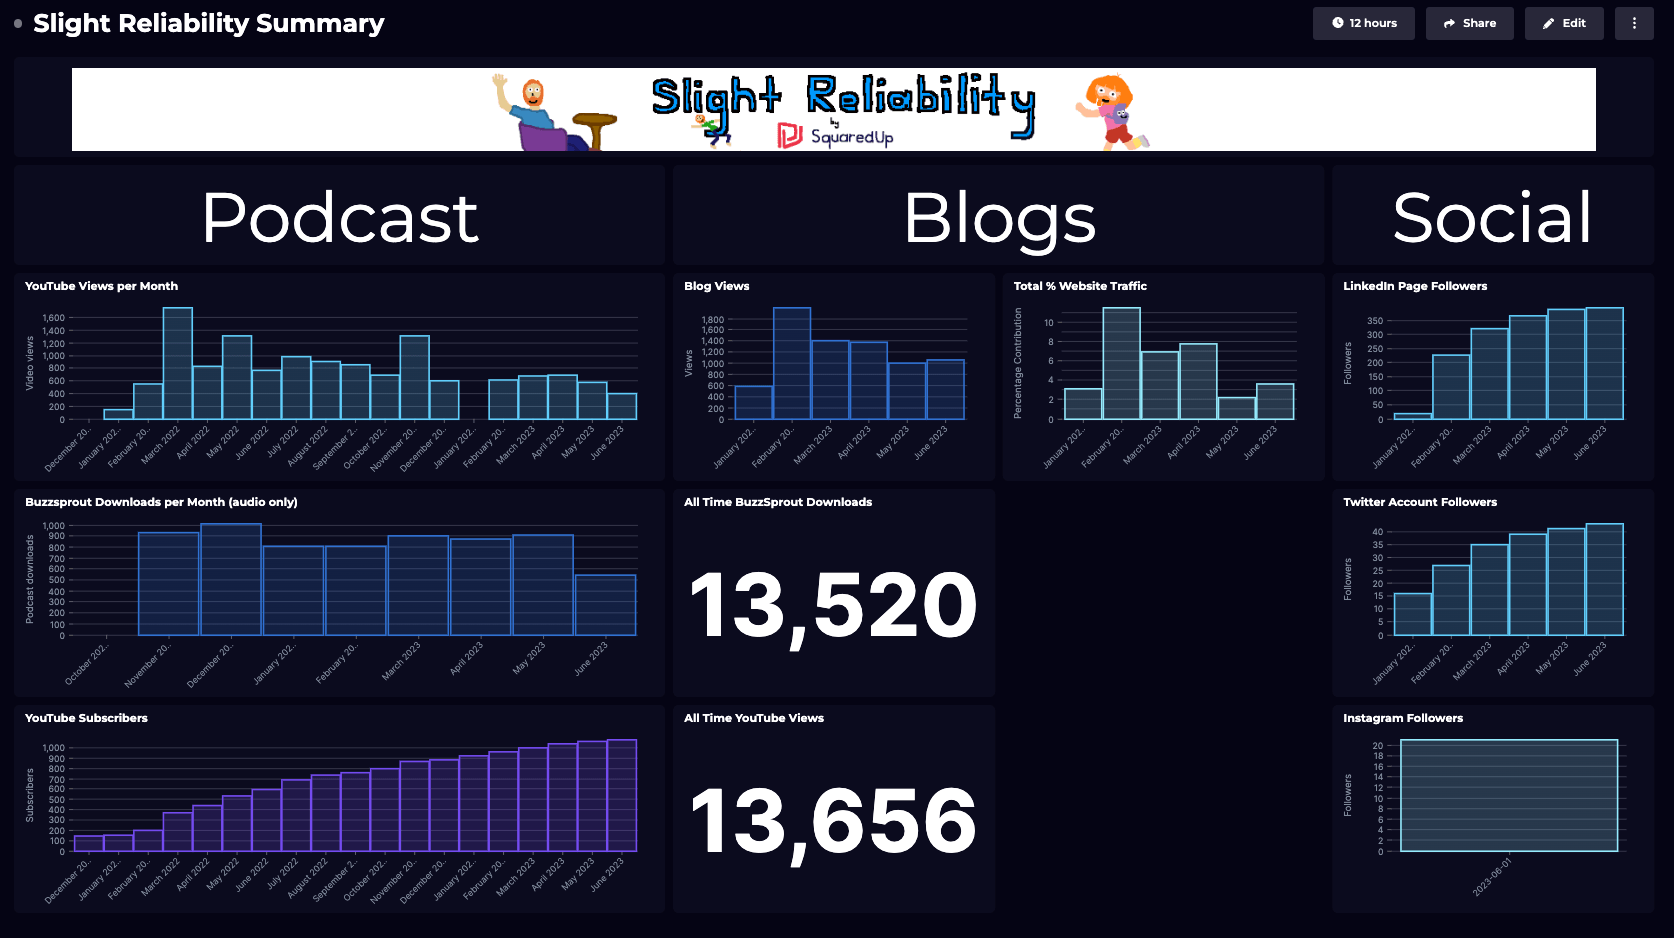
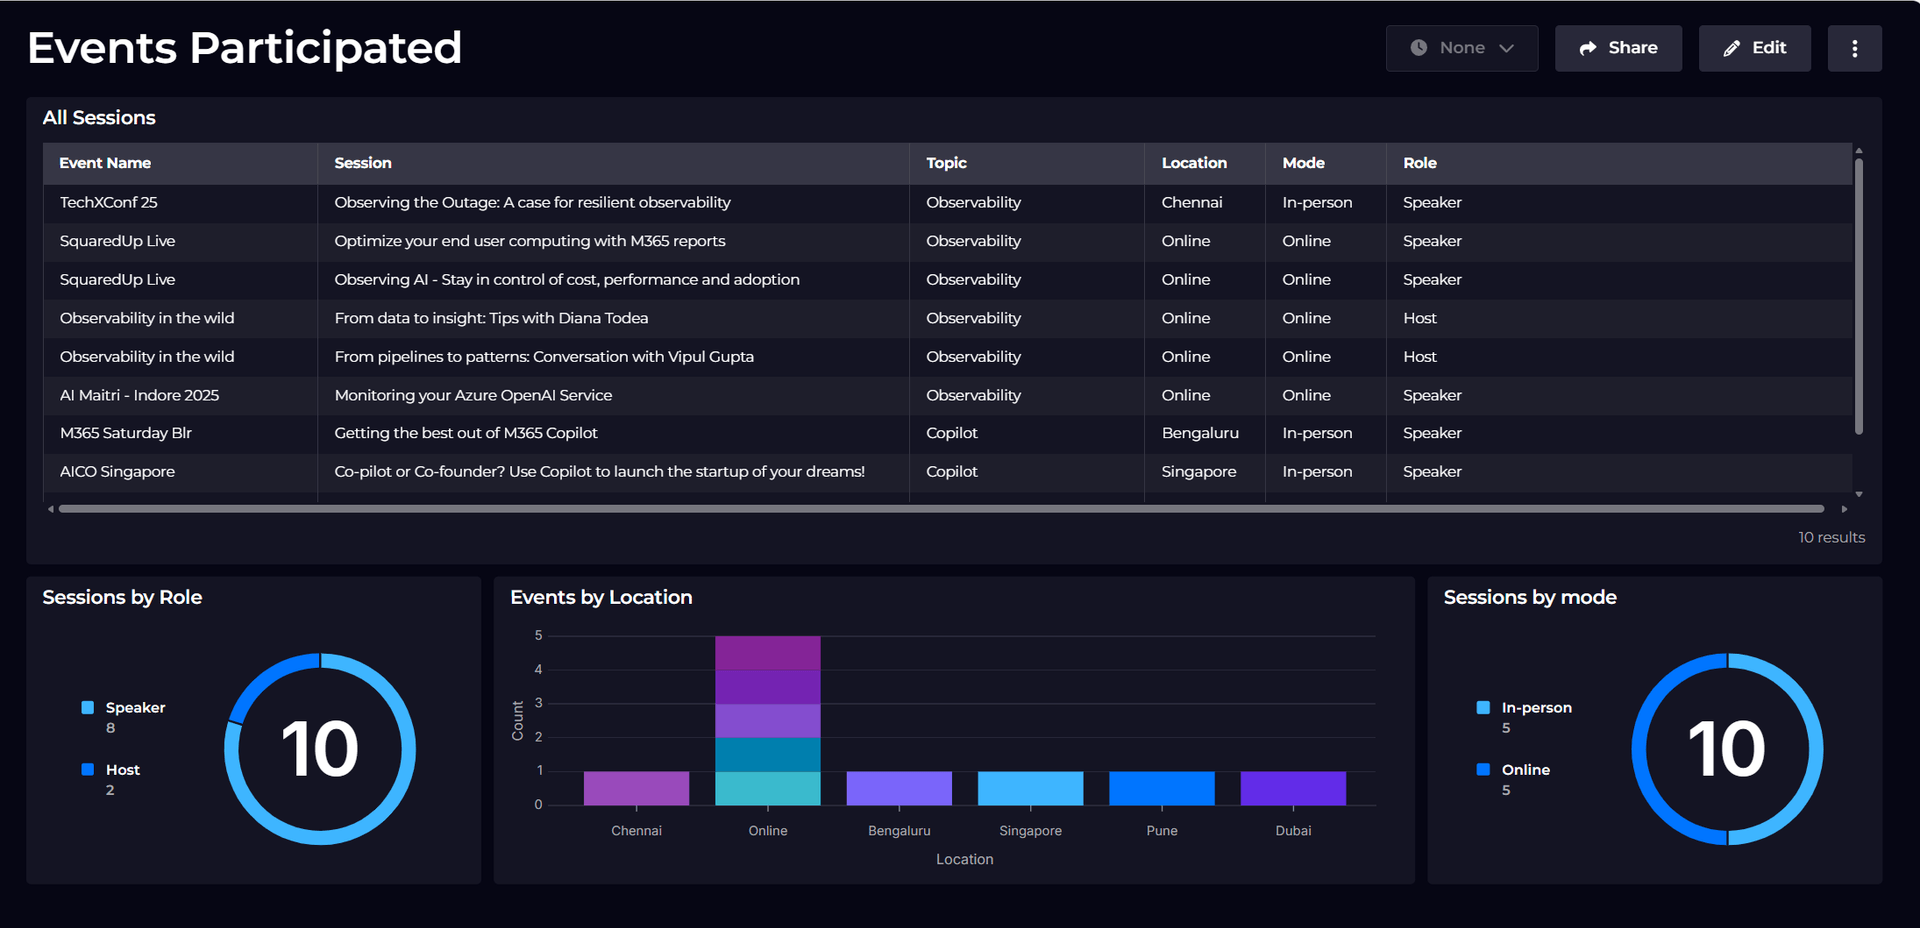
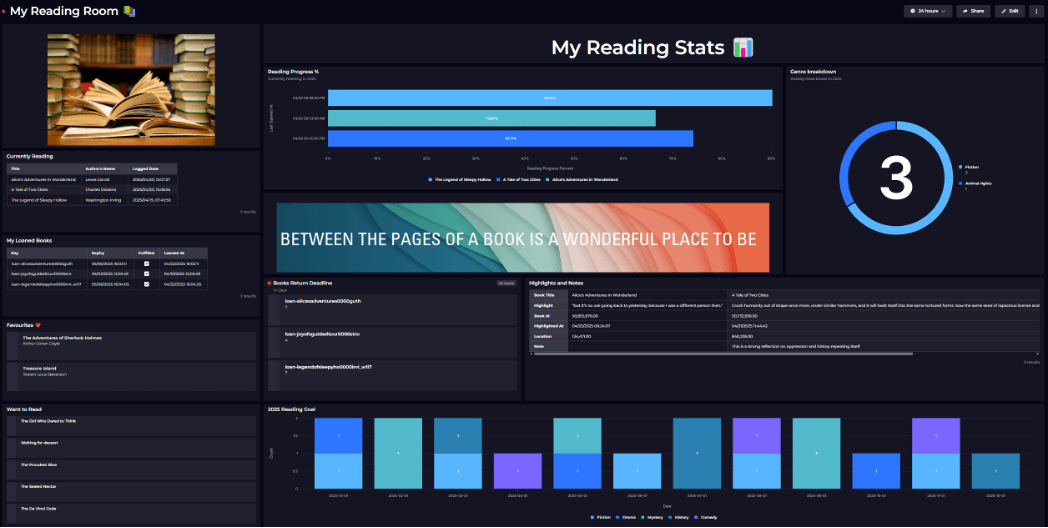
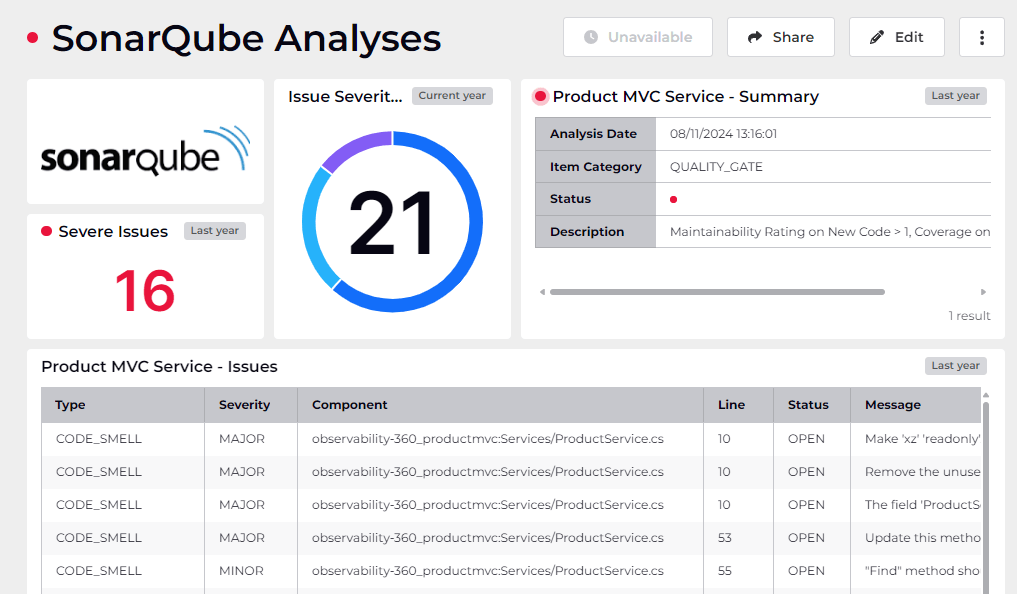
SquaredUp is the smart dashboard that makes it easy to visualize, monitor and share Web API data in minutes.
Get started free


Thanks to my dashboards in SquaredUp, we can have discussions based on facts, not fiction.

In this guide we will see how SquaredUp can connect to any REST APIs and bring the data back to create fully featured, smart dashboards.

Visualize and monitor data from PowerShell scripts with fast and flexible dashboards.