Blog
Getting started with Prometheus dashboards
A step-by-step guide to visualizing your Prometheus data with SquaredUp dashboards.
Prometheus is a wildly popular open source monitoring tool typically used for monitoring Kubernetes environments and containerized workloads. But how do you turn the mountains of metrics into a clear picture of health and performance?
SquaredUp plugs directly into your Prometheus database to visualize and monitor your data. What sets SquaredUp apart from other Prometheus visualization options like Grafana and Perseus is just how easy it is to visualize, monitor and share Prometheus dashboards. Combined with integrations for Azure, AWS, GCP and nearly 100 more, SquaredUp can be used to build comprehensive visibility of your infrastructure and applications.
In this article we’ll explore creating a custom dashboard to monitor Kubernetes cluster health:

Before you get started you’ll need a SquaredUp account. It’s free and easy to sign up here.
Connecting to Prometheus
Connecting to Prometheus requires some straightforward configuration, but it is important to decide how SquaredUp will connect and authenticate to your Prometheus server.
SquaredUp is cloud-hosted, so the two options to connect to Prometheus are either:
- Use the relay agent to connect to Prometheus (eg hosting the agent within the Kubernetes cluster)
- Connect to Prometheus via public URL
For more information on using the relay agent, check out the documentation here. If you are connecting via a public URL, authentication with API key or username and password will be essential along with whitelisting the SquaredUp IP addresses.
If you are connecting to Azure Managed Prometheus, we have a dedicated version of the plugin that has Azure authentication baked in.
When setting up the connection, you will see there are some options for ‘Object Indexing’. We’ll leave these checked for now, as they make it easier to query and explore the data in Prometheus once we’re connected.
Here’s our configuration:

Once the details are entered, click ‘Test and add’.
Connecting should take a few seconds. SquaredUp does not ingest the Prometheus data, so once SquaredUp has verified the connection, we’re ready to start dashboarding.
Creating a custom Prometheus dashboard
The Prometheus plugin comes with several pre-made dashboards for Kubernetes. These are a great place to start, and can be customized for your environment, but for the purposes of this walk-through we’ll create our own dashboard from scratch.
To get started, let’s add a new tile to our dashboard. After selecting the ‘Prometheus’ data source, we have two main choices for querying Prometheus:
- PromQL
- Simple query
Let’s start with PromQL and then compare it to the ‘Simple query’ data stream (which, as you can guess, is a simpler way of querying Prometheus).
Using PromQL
Here’s a simple PromQL query to show the top 5 containers by CPU usage:

Simply enter the PromQL, choose the visualization, and hit Save to add the tile to our dashboard. You can use this approach for any PromQL query and any visualization. If you need to combine multiple PromQL queries, you can also enable ‘SQL Analytics’ mode which pulls the data into a temporary, in-memory DuckDB database where it can be joined and aggregated.
Using Simple Query
Now let’s use the ‘Simple query’ option. This is going to enable us to query Prometheus without any PromQL!
We first select our 'objects'. These objects represent the Prometheus labels that were indexed when we connected to our Prometheus instance. In the background, this will automatically add the required label selectors to our PromQL query.

Next we select a metric. The dropdown is automatically scoped to the metrics that match the objects we selected. No guessing at the correct metric names!

Based on the metric we select, we’re prompted to choose options such as aggregations and filters. In the background, a PromQL query is built for us. If we want, we can select ‘Return PromQL’ to see the underlying query.
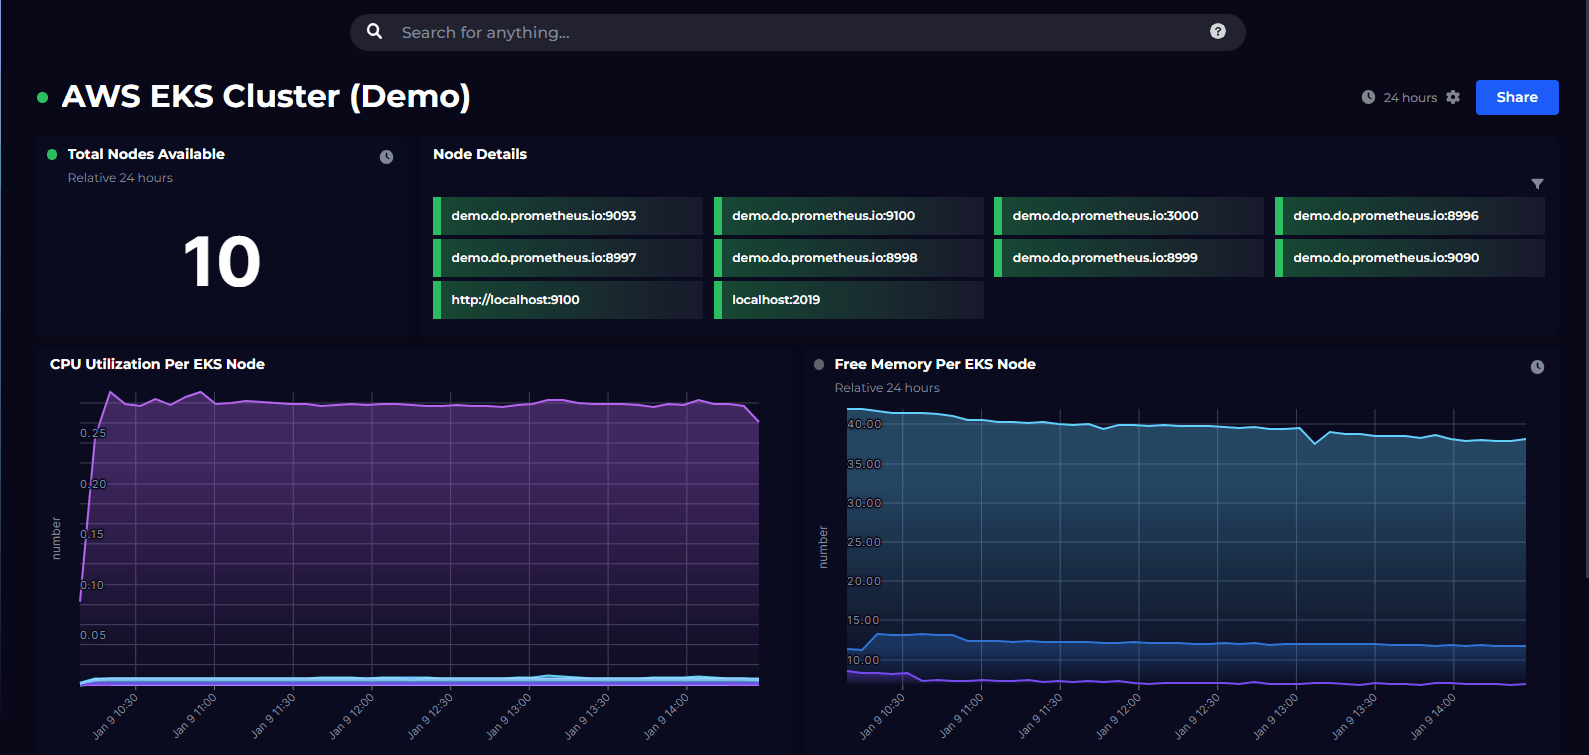
In this example we’re querying memory usage over time for our two nodes, so very quickly we can get to our visualization:

With some more of the same, we can very easily build our dashboard with tiles using different data sets and visualizations.
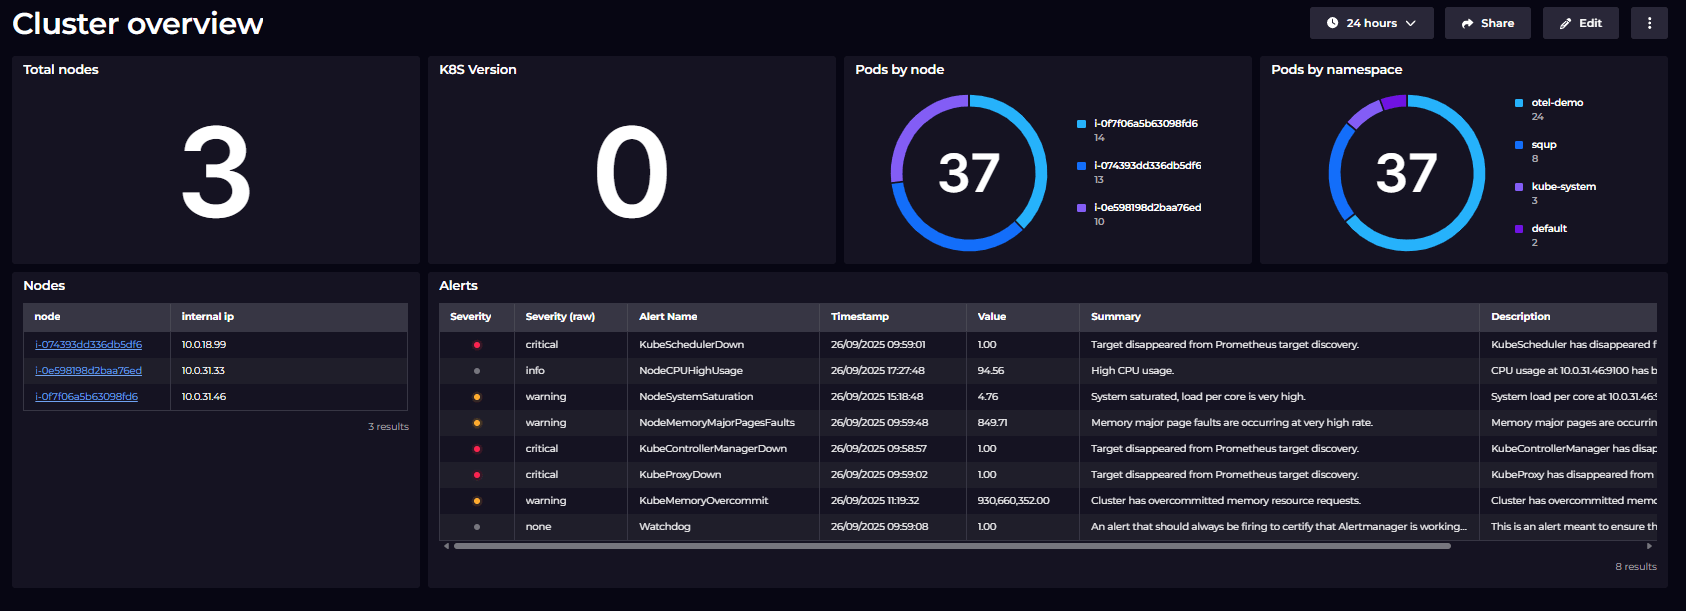
Here’s the finished article. This is actually very similar to the pre-made dashboard, so don’t worry about having to build this all from scratch. The purpose of this walkthrough was to show how easy it is to customize your own dashboards.
Sharing Prometheus dashboards
How do we share this dashboard with others — for example an application team who depend on this cluster and need to see the health when the troubleshoot? Well, sharing is very simple in SquaredUp. We just hit the Share button and have the option of inviting a user to our SquaredUp workspace, or we can share the dashboard via a simple link:

Monitoring Prometheus data
SquaredUp also makes it easy to monitor the data in our dashboards, so that we can be alerted about problems and changes without having to look at the dashboard. For example, we could set a threshold on the ‘Node memory’ tile to be alerted if we see high memory consumption.

Get started with SquaredUp dashboards for Prometheus
This was a quick walkthrough of creating a custom Prometheus dashboard using SquaredUp. You can use SquaredUp to monitor your Kubernetes-hosted service, or visualize and monitor any data collected by Prometheus.
In addition to Prometheus, SquaredUp supports nearly 100 other data sources — including Datadog, Elasticsearch, Splunk, Azure Monitor and AWS CloudWatch — enabling you to build comprehensive views of your applications.
Get started with SquaredUp today with a free account.
Visualize over 60 data sources, including: