John Hayes
Observability Advocate, SquaredUp

Understand how mobile observability fills the gaps traditional monitoring leaves behind
More than half of all connections to web services now originate from mobile devices. Mobile apps are no longer peripheral - they are central to how businesses engage customers, deliver services, and generate revenue. Despite this shift, many organizations still rely on observability tools that are fundamentally server-centric. These platforms are adept at monitoring backend health, but they often fail to capture what’s happening at the edge - on the mobile device itself.
This blind spot can be costly. Performance issues, crashes, or unresponsive user interfaces on mobile devices can silently drive users away, all while backend dashboards continue to show green. Without mobile-specific telemetry, teams risk missing the signals that matter most to end users.
Beyond Backend Metrics: Seeing What Users See
Traditional observability tools give a clear view of server-side performance. They track CPU usage, memory consumption, response times, and error rates on the backend. This is valuable, but it doesn’t tell the full story.
Imagine a user opening your app only to face a frozen screen due to a device-specific bug or a slow network connection. None of this will surface in backend logs. Mobile experiences are shaped by a unique set of variables: device type, operating system version, screen resolution, battery usage, and local network conditions - all of which fall outside the purview of conventional observability platforms.
Navigating the Unknowns of Mobile Environments
Observing performance on mobile devices means engaging with a broader and more fragmented ecosystem. Android users, for instance, may encounter the infamous ANR (Application Not Responding) dialog. If your telemetry doesn't capture such events, you're left with a dangerous knowledge gap. Crashes, jitter, frame drops, and latency spikes can all occur on the client side without leaving any trace in the server logs.
Embrace was built to close this gap. It offers a mobile-native observability platform designed from the ground up to capture the nuances of mobile user experience. Its SDK instruments apps to detect ANRs, network interruptions, device-specific crashes, and resource bottlenecks. Where most observability platforms lose visibility beyond the server, Embrace starts its monitoring journey directly on the user’s device.
Bringing Embrace Data into SquaredUp Dashboards
While Embrace captures the right signals, visualizing and sharing those insights requires a flexible, integrative platform. That’s where SquaredUp comes in. With its support for custom data sources and interactive dashboards, SquaredUp allows teams to bring Embrace’s telemetry into clear, actionable focus. Naturally, you can also use our range of 70+ data sources to view your mobile application analytics alongside data from web and backend applications, all within a single pane of glass.
In this article, we’ll walk through how to connect Embrace to SquaredUp using the Web API data source. We’ll use the Embrace Sample App for demonstration purposes, though the approach scales easily to real-world production environments.
Initial Setup: Connecting SquaredUp to the Embrace API
Begin by creating a new dashboard in SquaredUp. When prompted for a data source, select Web API.
Configuring the data source is very straightforward. We just need to enter the address of the Embrace Web API and then add an Authorization header. The Authorization header will take the form “Bearer <your API key>”

With the data source configured, add a new tile to the dashboard and select the Web API data stream. The only available stream is HTTP Request, which is sufficient for our use case.
We now need to configure our parameters. On the Basics tab, we need to set the path for a range query:

The next step is to enter the values for our parameters. We want to create a tile which gives an hourly breakdown of the total number of mobile user sessions for our app, so we will use the ‘hourly_sessions_total’ query.
The value for step is defined in seconds, so for an hourly breakdown we enter 3600. The only tricky bit here is that the API expects the date parameters to be expressed as a timestamp. You can either do this with a simple Powershell function:
$START_TIME = [int]([DateTimeOffset]::UtcNow.AddDays(-2).ToUnixTimeSeconds())
or use a resource such as Unix Timestamp (Epoch) Converter.
Transforming Responses with JavaScript
Next we will look at the Response configuration. For this we will be leveraging the power of the new scripting capability in the Web API data source. This allows us to supply a block of JavaScript which remaps the JSON response so that its structure matches our needs. In this example, the raw JSON that we receive is a hierarchical structure where metadata and metrics are in many-to-one child/parent relationships. This is a simplified view of the raw data:
"result": [ {
"metric": { "__name__": "hourly_sessions_total",
"app_version": "2.1.2",
"device_model": "iPhone Simulator"
},
"values": [
[1754568000,
"88"
],
[1754571600,
"45" ]
We need to rework this into a tabular format where each row contains the device model and the metric values. To do this we click on the Script option and enter the following JavaScript:
const values = data.data.result.flatMap(series => {
const deviceModel =
series.metric.device_model && series.metric.device_model.trim() !== "" ? series.metric.device_model
: "Other";
return series.values.map(([timestamp, value]) => {
const date = new Date(timestamp * 1000).toISOString();
return {
deviceModel,
timestamp,
date,
value };
});
});
return values;
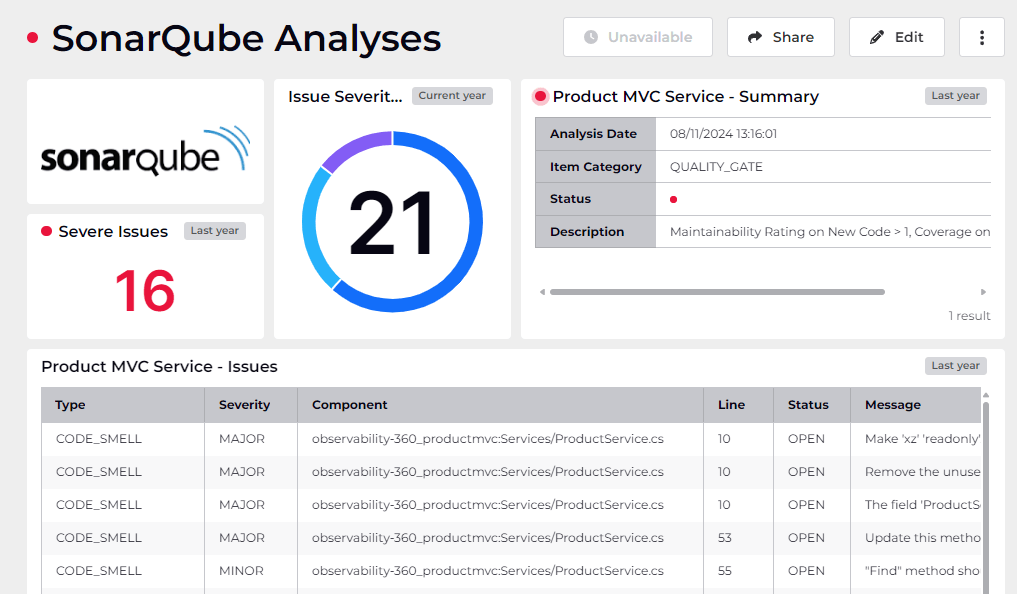
This script extracts the device model from the metadata and injects it into each value entry. The result is a tabular dataset where each row includes the device model, timestamp, and metric value. This structure supports more granular visualizations, such as grouping session counts by device type:

Analyzing Latency with Span Buckets
In addition to sessions, latency distribution is a vital performance metric. The hourly_span_count query provides this, breaking request durations into predefined buckets (e.g., 0–100ms, 101–200ms). To prepare this data for visualization, use a similar JavaScript transformation:
const values = data.data.result.flatMap(series => {
const durationbucket = series.metric.root_span_duration_bucket; return series.values.map(([timestamp, value]) => {
const date = new Date(timestamp * 1000).toISOString();
return {
durationbucket,
timestamp,
date,
value
};
});
);
}
return values;
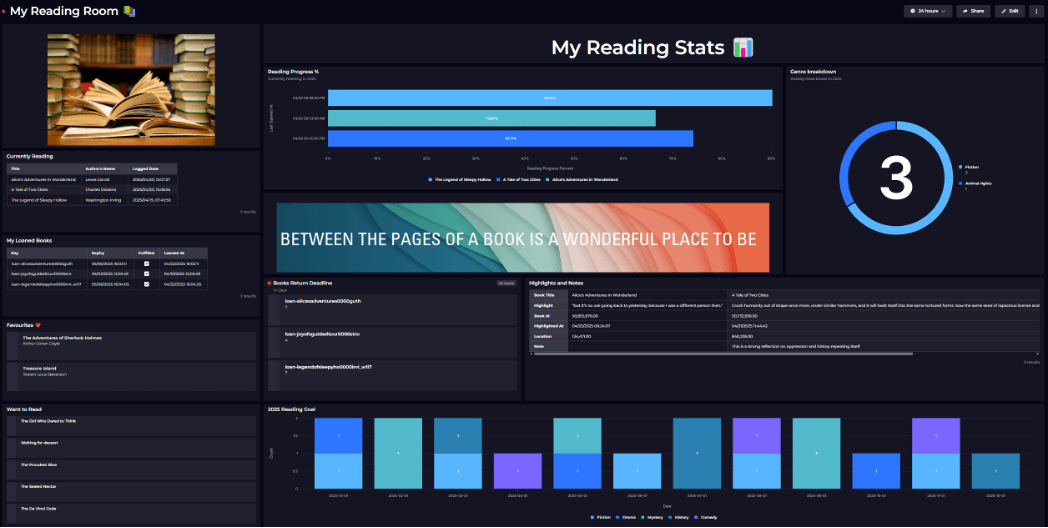
This enables rich, bucketed visualizations like the one below, showing how performance is distributed across different latency thresholds over time:

From Data to Decisions: Sharing Insights
Once configured, SquaredUp’s dashboards allow teams to surface Embrace’s telemetry in a format that is easily digestible. Whether you’re an engineer troubleshooting performance regressions or a product manager tracking adoption, this visibility bridges the technical and business perspectives.
Dashboards can be shared across departments or embedded in broader observability suites. This helps to democratize access to performance data and ensures that mobile signals are no longer trapped in siloed tools.
Conclusion
Mobile observability is not a niche requirement - it’s a necessity for any organization with a mobile footprint. Server-side health is only one side of the equation. Without visibility into the client-side experience, you’re guessing at best.
Combining the rich data of the Embrace API with the unlimited flexibility of SquaredUp’s dashboarding platform means that you can bring signals from your mobile, web and other applications together in a single pane of glass.
.
Observability Advocate, SquaredUp


Getting started with SquaredUp is free and easy. Our free tier includes: