Noorul Huda N
DevRel Engineer

The Jira plugin is one of our most-used integrations and for good reason. Teams rely on it daily to stay on top of work, manage issues, and ship on time. As more people leaned on it, we saw a chance to make the experience even smoother.
So, we gave it an upgrade.
We’ve refreshed the out-of-the-box dashboards, simplified the data streams, and improved the overall experience.
So, let’s take a closer look at what’s changed.
We’ve made the out-of-the-box dashboards way more user-friendly. They now load reliably, even in large environments, and highlight what matters most.
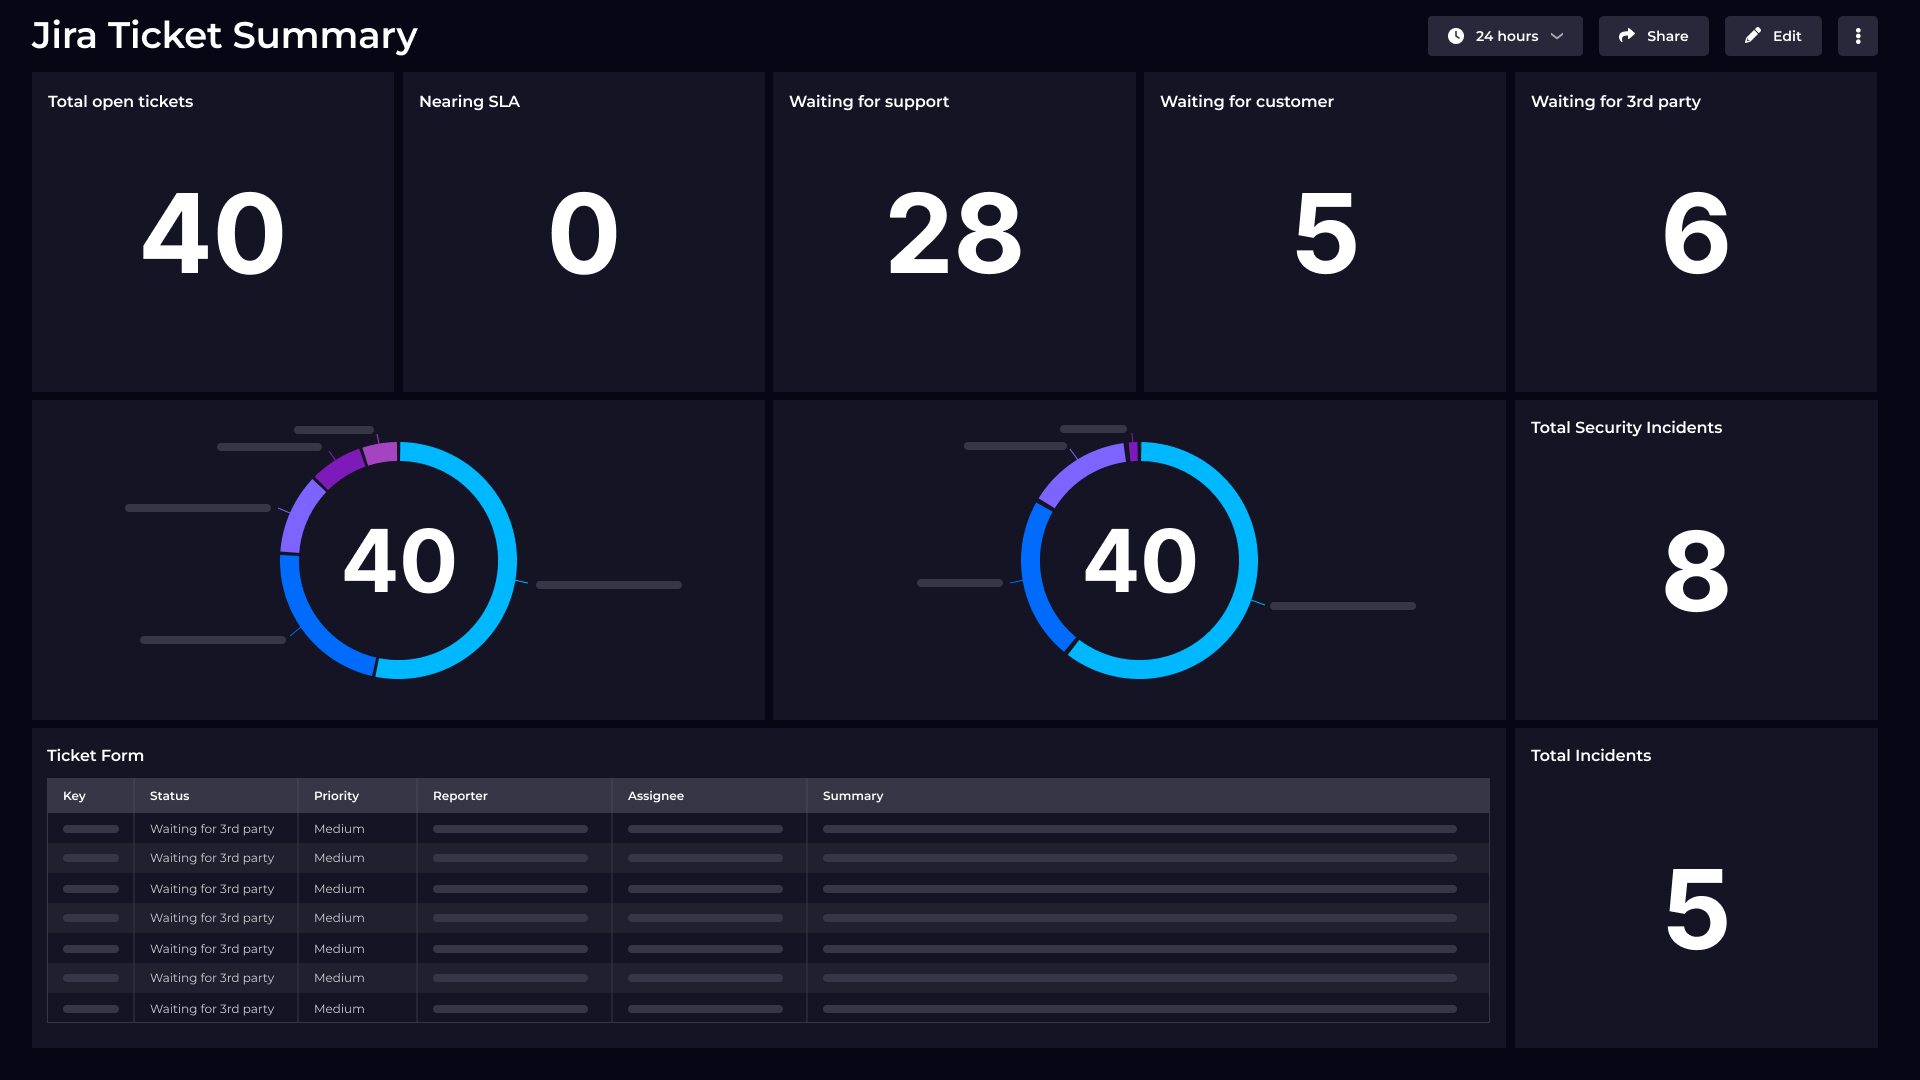
You’ll now land on an Organization Overview dashboard that gives you a clear, consolidated view of your key projects, work items opened across teams, bugs created vs. resolved, and any upcoming release due dates. It brings just the right amount of detail to help you stay on top of things.
Click into any project, for example, the SquaredUp project, and you’ll see three dedicated perspectives:
KPI Summary: An overview of key metrics, modeled closely on what you see in Jira.
Bugs: A quick read on how you’re doing with issue resolution. Spike? Trend? It’s all there.
Releases: See what’s shipping and when, helping you stay ahead of deadlines.
To get the new out-of-the-box experience, head over to the Jira datasource overview and click Install Dashboards.
From there, you can choose which pre-built dashboards you want. Pick the ones you need or select all and then click Install.
Let’s dive into some of the biggest improvements we’ve made to the data streams.
Improved Aggregation for JQL Data Stream
If you use custom JQL queries, you’ll love the added control and flexibility we’ve introduced.
The JQL data stream - one of our most popular thanks to its precision and customizability—now supports aggregated results.
That means you can group and summarize your JQL query results by any field you choose. It’s a great way to get high-level insights without pulling in every single detail.
You can choose to display counts or, for even more flexibility, use aggregation to group by priority, assignee, status, or any other field that helps you understand the bigger picture.

New “Filters” data stream for custom queries
Previously, custom filters in Jira were bundled inside the Work Items data stream, which made them a bit harder to work with, especially if you just wanted to view or manage them on their own.
Now, we’ve created a dedicated Filters data stream, making it much easier to bring in the Jira filters you already use regularly, so there’s no need to recreate them with Work Items or JQL. It’s a great starting point if your team already relies on saved filters day to day.
This data stream also supports aggregated results, allowing you to get a summary view of your data.
If you want to see the full results, you can also select only the columns that matter to you. This way, it’s much more efficient, since you apply filters upfront and get exactly what you need, instead of pulling in all the data and filtering it afterwards.

Improved Filtering and Aggregation in Work Items data stream
We’ve made the Work Items data stream more scalable. Now, you can select multiple item types using the improved filter, so you capture everything relevant that you want to see.
Here’s a short video showing how filtering works:

We’ve also enhanced aggregation options similar to those in the JQL query and Filters data streams, giving you more control over how your data is summarized.
This is especially useful when working with large volumes of tickets, you can choose to display counts or, for even more flexibility, use aggregation to group by any field that helps you understand the bigger picture.
Pro tip: Monitor your Work Items Over Time:
One powerful data stream to keep an eye on is Work Items Over Time. It’s ideal for spotting trends and patterns, understanding progress, and making decisions based on how your Jira data has changed over time.
For example, you can track how many high- and critical-priority bugs were open at any point over the past year. This helps you identify spikes in workload or recurring issues.
Here’s how you can set up the Work Items Over Time datastream to capture this:
We’ve made some major upgrades under the hood to improve stability, performance, and scalability across the board.
Paging is now handled more efficiently, helping large datasets load smoothly. We’ve also introduced better request handling to prevent overload and reduce timeouts., and dashboards remain responsive even when working with a high volume of Jira issues.
These behind-the-scenes improvements might not be flashy, but they make a big difference in how fast and reliably everything runs.
Our improved Jira plugin makes it easier to build clear, reliable dashboards that keep up with you – no matter how complex your projects get.
With improved filtering, smarter aggregation, and a smoother out-of-the-box experience, you’ll spend less time wrangling data and more time getting work done.
It’s ready to go – just update your dashboards and give it a spin.
As always, we’d love to hear how it’s working for you.
SquaredUp’s smarter dashboards help engineering, product, and IT teams make better decisions through a deeper understanding of their data. We have a completely free tier available for you to use today. Sign up for free now!
DevRel Engineer


Getting started with SquaredUp is free and easy. Our free tier includes: