Luke Gackle
ICT Service Desk Officer, South Australian Tourism Commission

Getting started with SquaredUp is free and easy. Our free tier includes:
This Jira ticket summary dashboard was built to give my Support Team an instant overview of ticket statuses and which are near an SLA breach so they can jump on those quickly!
ICT Service Desk Officer, South Australian Tourism Commission
I wanted to create a dashboard that would show at a glance what status tickets are sitting at. I also wanted to be able to show if any tickets were near an SLA breach so that our team could jump on them quickly! Unfortunately, there isn’t a good way of displaying these numbers in a native Jira dashboard.
I built a SquaredUp dashboard using Jira data to fill in the blanks that I couldn't get from the native Jira dashboard.
Overall, the dashboard works perfectly as our key overview / reference point for our daily stand-ups. It helps me keep tabs on the status of things on the whole.
The big thing that attracted me to the platform was not only the customizability, but the number of data connectors, and the ability to pull custom data.
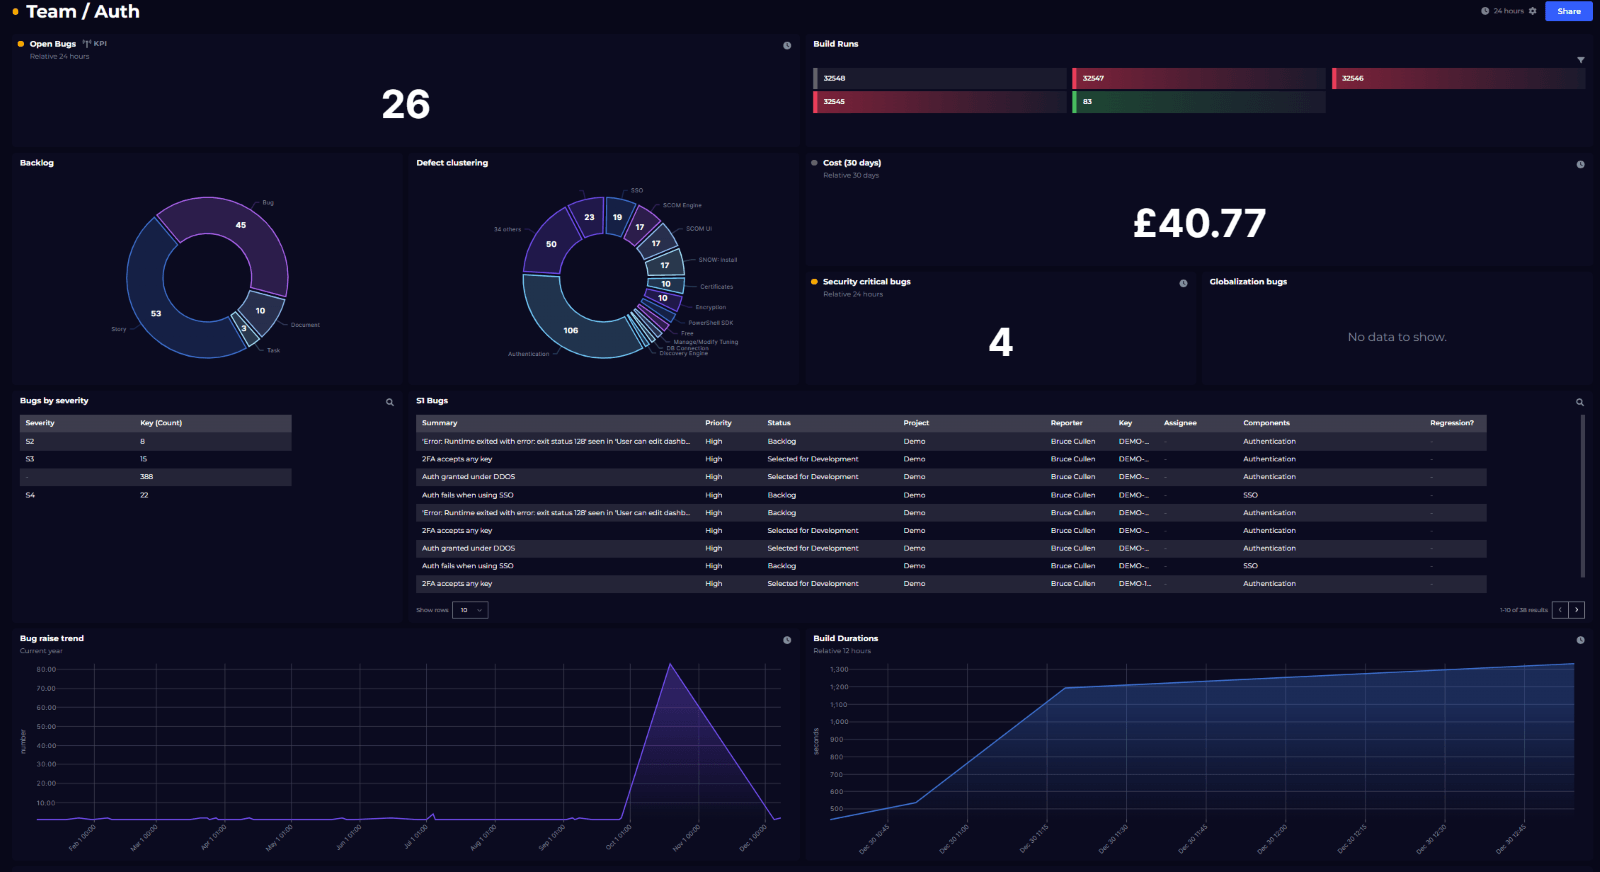
Ticket status
The top tiles are scalars showing the number of tickets for each status. This includes:
I also visualized some of this data in a donut chart to show the proportion of tickets for each type of status.
The donut chart on the left depicts how many tickets are assigned to each team member so we can see at a glance if someone is overloaded. If so, we can take action to ensure our staff are attended to and not left waiting at the bottom of the queue.
These two views gave me a clear overview of what status tickets were sitting at and whether there was anything urgent to fix.
Key details summary
I also included a table that reflects the key details around each ticket:
This is helpful as a quick view of outstanding tickets accompanied by the most relevant details – without the need to go into JIRA.
Incident metrics
I also included two tiles on the number of incidents this year:
The first tile reflects specifically the number of cyber security incidents we’ve had so far this year, and the second shows the number of general incidents / outages this year.
These metrics show where we are tracking. If we've dealt with 9 cyber security incidents, for example, we can see that what we are doing is working. I'd also like to investigate having a dashboard like this up on a screen somewhere, which would give the rest of our agency some level of visibility on the work we are doing and the value it contributes to the agency.
This Jira ticket summary dashboard is not available out of the box, but you can easily build something similar yourself using the Jira plugin.
Simply create a free account to get started, or check out this video to see how easy it is to use our Dashboard Designer:
To see what other dashboards you can create, check out our Dashboard Gallery.