John Hayes
Observability Advocate, SquaredUp
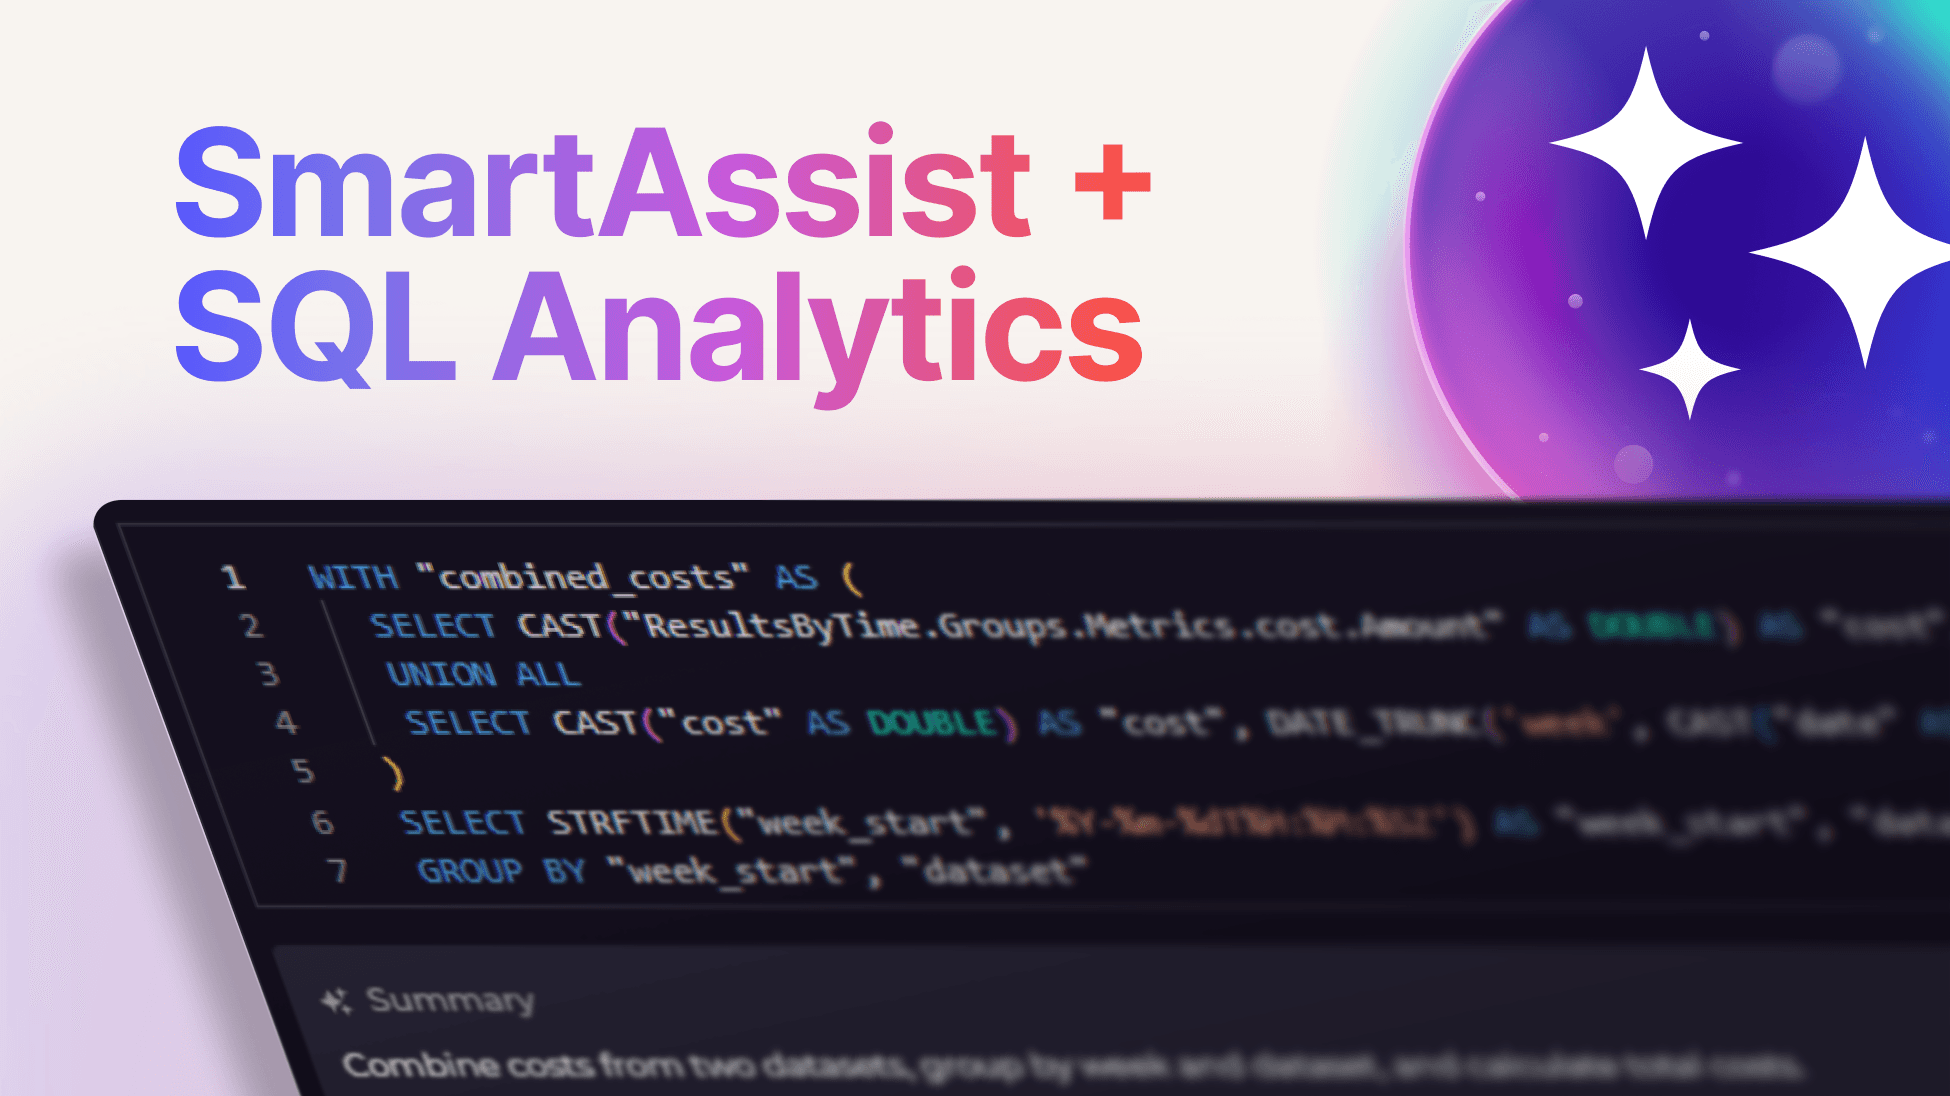
Now you can query and transform your data without having to know SQL
SQL Analytics has always been one of my favourite SquaredUp features. That's not just because I can use raw SQL to achieve complex data transformations. The fact that I can run SQL queries over data from all sorts of sources — not just relational databases, gives incredible power and flexibility.
The great news is that SQL Analytics now ships with our AI-driven SmartAssist technology. If you are not familiar with SmartAssist, it is our in-product chat assistant that helps you write queries, work with data, create visualizations, and troubleshoot issues directly from SquaredUp.
In this article we will show how SmartAssist enables any user to build sophisticated queries and visualizations using natural language prompts.
Last year I wrote this article, which showed how you could use SQL Analytics to run a single query across data from two different sources — Azure Costs and AWS costs. In this article I will be looking at achieving the same effect, but with SmartAssist.
First, let's get things set up. We need to create a dashboard tile to retrieve our cost data. For this we will use the SquaredUp AWS and Azure Data sources. To do this, we can add a new tile and select the AWS Pluginand the Cost (Global) data stream:
Then select the accounts we want to report on:

Next we are going to turn on SQL Analytics for this dashboard tile:

When we do this, you will see that the data we have selected is captured as a dataset. We also now have a query editor with a default SQL statement. We are now going to click on the Add dataset button so that we can generate a dataset for Azure cost data:

We will now be prompted to select a data stream. From the Data Source drop down list, select the Azure data source. Now we can select the Azure Cost data stream:

Next we select our scope. We are going to enable Dynamic selection and select all of our Resource Groups:

We now have two datasets with the default names of ‘dataset1’ and 'dataset2'. Let's rename them AwsCosts and AzureCosts respectively. In the previous article I used this query to combine the data from the two datasets:
SELECT SUM(Total) as CombinedTotal FROM
(SELECT "ResultsByTime.Groups.Metrics.cost.Amount" as Total FROM AwsCosts
UNION SELECT cost as Total FROM AzureCosts)
If you were not familiar with SQL, you would have probably hit a bit of a dead end at this point. With SmartAssist however, all you have to do is describe the result you want, and it will take care of the rest. SmartAssist is aware of your context. If you click on the AI sparkle icon in the top right hand corner of the query window, the SmartAssist chat window will open. As you can see, it already knows that we want help with a SQL query:

I am going to enter a request that just expresses my intent. I am not going to use any SQL commands or even mention the relevant field names:

Now I will hit the preview button and see the query that SmartAssist has generated:

That looks absolutely perfect. SmartAssist has identified the Cost fields, figured out that we need a UNION query and also carried out the necessary data type conversions. Now I will just click the Apply button and the solution will be copied into my query window.

Now I can just hit Execute and see the result:

On reflection, maybe I should have asked SmartAssist to format the total to two decimal places. I could submit an amended request or I could just use SquaredUp’s column formatting functionality. Either way — all the heavy lifting has been done. If we do want SmartAssist to do the rounding, we don’t have to re-enter the full query. We can just say something like this:

Now when I hit preview I can see my existing query and the suggested new version side by side.
I can see here that in the new version, SmartAssist has now used a ROUND function. Now we can just apply the changes and execute the query again.
You can also use SmartAssist to build up your dashboard tiles step by step. I might decide that rather than one overall total, I would like a weekly breakdown:

Once I’ve executed that I might decide that I would like the totals to also be broken down by cloud provider:

And then I would like to display the results as a column chart:

SmartAssist will now generate a query which makes sure that all my data is correctly formatted for the visualization engine to generate my chart:

Now I just need to select the bar chart visualization and define dataset as my series and switch on the Show As groups option:

Vibe dashboarding is pretty cool!
However, SmartAssist isn’t just limited to generating SQL queries. It is, actually very smart and can also help with debugging when your queries don’t quite work as you expect — for example if you think you have duplicate rows or missing data.
SmartAssist is not restricted to SQL Analytics – it is also there to help with creating queries in the Tile Editor and when adding scripts. You can get full details in the SquaredUp documentation.
SmartAssist is available now for all SquaredUp enterprise customers. Just create a new dashboard or edit an existing one and get chatting!
Observability Advocate, SquaredUp

Getting started with SquaredUp is free and easy. Our free tier includes: