Louise Berry
SquaredUp
Is Jira reporting creating a bottleneck in your team?
SquaredUp
A recent survey revealed that developers and engineering teams waste 8+ hours a week on inefficiencies in their role. Poor reporting tools are a main contributor, with Jira being regarded as a frequent source of friction. But since Jira is so deeply embedded in most organizations' infrastructure and processes, replacing it is not really an option. Rather, the solution lies in optimizing how users interact with it rather than abandoning it altogether.
Out on the market, there are a number of software products that address Jira’s common pain points directly, offering intuitive interfaces and automated reporting that keep teams focused on their tasks rather than admin. We took the top three: SquaredUp, Jira’s native reporting tool, and Power BI, and put them to the test. Here’s a quick summary before we deep dive into all three:
SquaredUp: A unified dashboard platform that transforms complex IT and business data into intuitive, real-time visualizations without requiring technical expertise to set up or maintain.
Jira native tool: Jira has handy built-in reporting features that provide basic project insights, but these often require significant customization and technical know-how to generate meaningful, stakeholder-ready reports.
Power BI: Microsoft's robust business intelligence suite that offers powerful analytics capabilities, though it typically demands dedicated BI expertise and can overwhelm teams looking for straightforward operational dashboards.

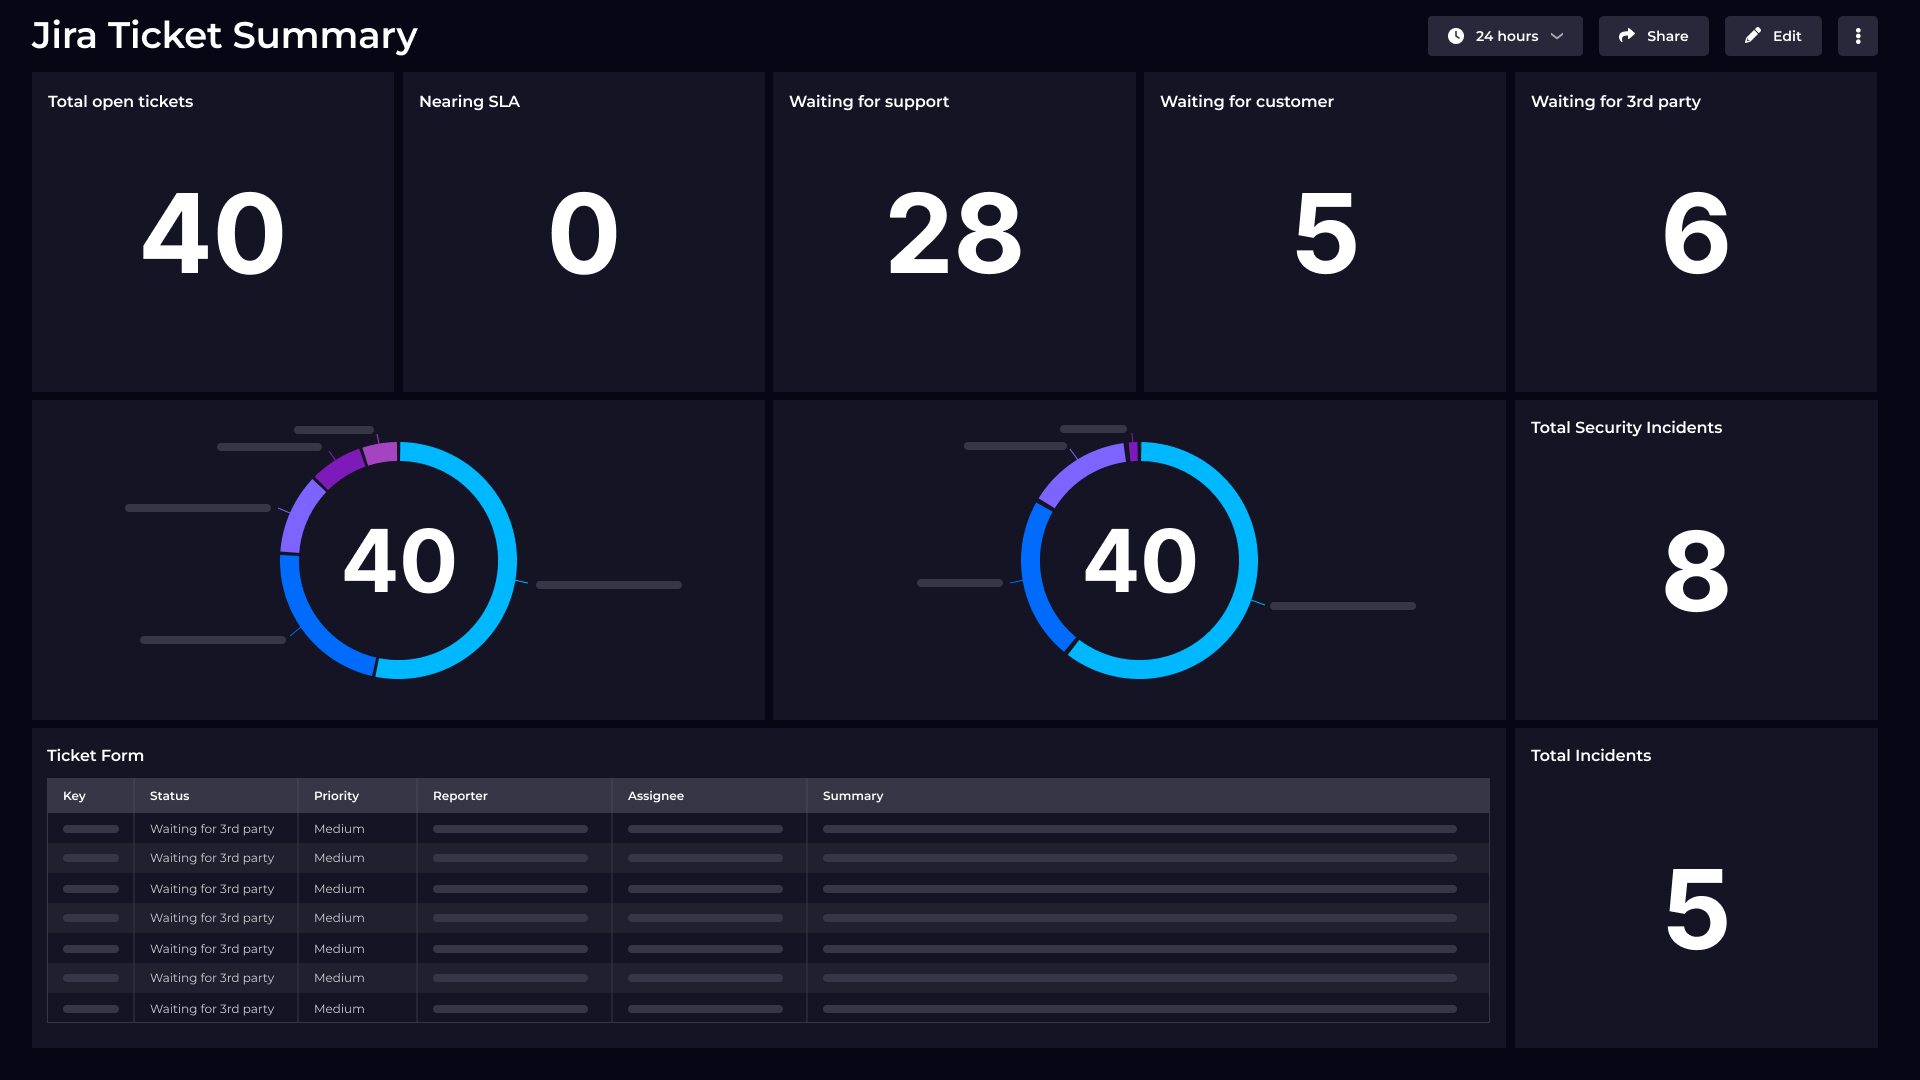
SquaredUp stands out for blending ease of use with the ability to build flexible, real-time dashboards that unify Jira data with dozens of other engineering and business platforms. Its intuitive interface empowers technical and non-technical users to design dashboards without coding, while robust integration options eliminate data silos. Pre-built templates, real-time visualizations, and rapid deployment mean teams can start gaining insights in minutes rather than weeks.

Jira’s built-in dashboards and reports are the foundation for agile project visibility, offering instant updates on stories, bugs, tasks, and releases. Native reporting excels at keeping project teams up to date on their progress without any extra setup.

Power BI is a leading business intelligence platform from Microsoft, renowned for its advanced analytics, visualization flexibility, and enterprise-grade data integration. Increasingly, teams use Power BI to build comprehensive dashboards and custom reports by connecting Jira data with other organizational systems.
Feature | SquaredUp | Jira Native Reporting | Power BI |
|---|---|---|---|
| Ease of use | Point-and-click dashboard designer, intuitive setup | Standard dashboards, basic customization | Advanced but steeper learning curve |
| Data integrations | 60+ pre-made integrations; no ingestion costs; real-time mesh | Focused on Jira data; limited external sources | Broad; connectors for many sources |
| Visualizations | Dynamic library; rich tiles; status diagrams; image/text | Core charts (burndown, velocity, etc.) | Extensive custom and interactive visuals |
| Operational intelligence | Rollup views, smart drilldowns, context-rich notifications | Project-centric, agile-focused reports | Business-focused analytics, large dataset support |
| Customization & analytics | Embedded SQL analytics, custom queries, unified editor | Customizable dashboards; add-ons needed for advanced features | Python/R custom visuals, advanced modeling |
| Collaboration | Seamless sharing, contextual notifications, multi-destination | Share via links/access control | Deep integration with Microsoft Teams, PowerPoint, Azure |
| Real-time monitoring | Near real-time alerts and flexible notification rules | Relies on Jira workflow updates | Scheduled refresh; not always instant |
| Community & support | Active expert community; high satisfaction (97.8%) | Atlassian ecosystem; moderate support | Large global user base; Microsoft support |
| Deployment & costs | No data migration; pay for insights only; scalable | Included with Jira; costs for add-ons | Standalone license; pro costs, integrations |
To wrap up, SquaredUp is hands down the go-to tool for Jira reporting if you want something that’s easy to use, quick to set up, and genuinely helpful every day. It pulls together your Jira info and data from all sorts of other tools into simple, clean dashboards that anyone on the team can understand and act on. No need for complicated setups or being a data whiz to get meaningful insights.
Compared to Jira’s built-in reports, which are useful but pretty basic, and Power BI, which is incredibly powerful but can be tough to master, SquaredUp strikes the perfect balance. It gives you real-time views, rich visuals, and seamless sharing without any steep learning curve.
So, if you want your Jira reports to actually help your team move faster and make smarter decisions – without the usual headaches – SquaredUp is where to start.
SquaredUp’s smarter dashboards help engineering, product, and IT teams make better decisions through a deeper understanding of their data. We have a completely free tier available for you to use today. Sign up for free now!
SquaredUp


Getting started with SquaredUp is free and easy. Our free tier includes: