Sameer Mhaisekar
DevRel Engineer, SquaredUp & Microsoft MVP
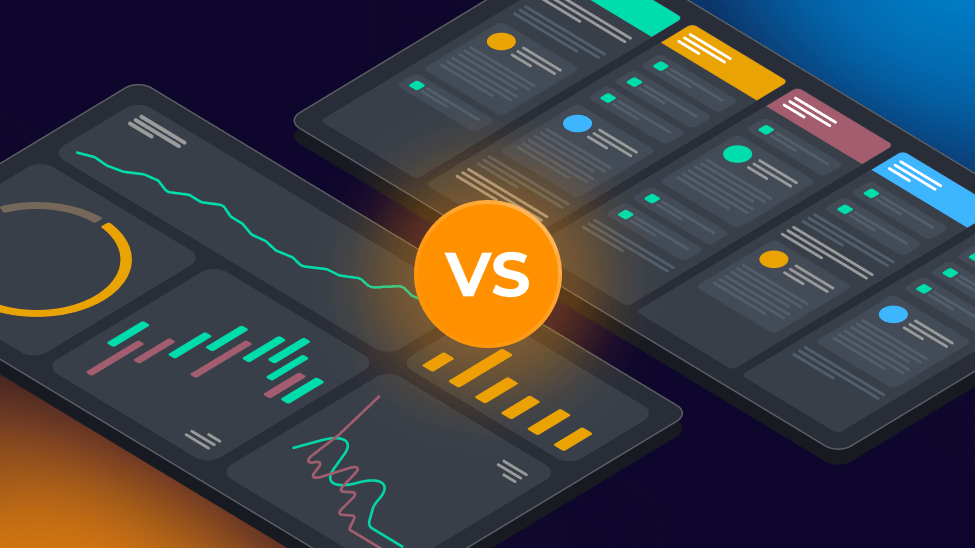
Comparing top 4 best Zabbix dashboarding tools against SquaredUp
Zabbix collects a huge amount of operational data—metrics, alerts, host status, and performance trends. But turning that data into dashboards people actually use is a different challenge.
Most teams start with the built-in dashboards. Then the requests start coming:
At that point, basic dashboards aren’t enough. Teams start looking for ways to augment Zabbix visualization with tools that improve usability, sharing, and flexibility.
This article compares five common approaches to Zabbix dashboards - looking at what they do well, where they fall short, and which option works best if your goal is quick, effective dashboarding without unnecessary complexity.
SquaredUp is purpose-built for operational dashboarding across monitoring platforms like Zabbix.

Instead of exporting data or building pipelines, SquaredUp connects directly to Zabbix through its API and visualizes live data instantly.
SquaredUp strikes a balance that other tools miss. It provides live dashboards with minimal setup, while still supporting cross-platform visibility and easy sharing. That combination makes it especially effective for teams that want results quickly.
Zabbix includes built-in dashboards that provide real-time visibility into hosts, metrics, and alerts. Since they’re part of the platform, they require no integration or additional tools.
Native dashboards are a solid starting point for operational monitoring. But when teams want richer visuals, easier sharing, or cross-platform visibility, they quickly run into limitations.
Grafana is one of the most popular monitoring dashboard tools and integrates with Zabbix through a dedicated plugin.
Grafana is powerful and flexible, especially for engineering teams. However, building and maintaining dashboards often requires technical knowledge and ongoing setup.
Kibana is part of the Elastic Stack and is widely used for analyzing large datasets such as logs and metrics.
Kibana is powerful for large-scale analytics and log analysis, but it’s usually more infrastructure than most Zabbix teams need just to build dashboards.
Microsoft Power BI is a business intelligence platform designed for enterprise analytics and reporting.
Power BI is excellent for business analytics and reporting. However, it’s not ideal for fast, operational monitoring dashboards.
Here’s a quick comparison of the five tools across key parameters.
| Feature / Capability | Zabbix Native Dashboards | Grafana | Kibana | PowerBI | SquaredUp |
| Zabbix Integration | ✅ Native | ✅ Plugin | ⚠️Requires data pipeline | ⚠️Connector / export | ✅ API plugin |
| Real-Time Data | ✅ Yes | ✅ Near real-time | ⚠️ Depends on ingestion | ❌ Refresh-based | ✅ Near real-time |
| Ease of Setup | ✅ Very easy | ⚠️ Moderate | ❌ Complex | ⚠️ Moderate | ✅ Easy |
| Ease of Use | ⚠️ Basic | ⚠️ Moderate | ❌ Advanced | ⚠️ Moderate | ✅ User-friendly |
| Multi-Source Data | ❌ No | ✅ Yes | ✅ Yes | ✅ Yes | ✅ Yes |
| Ease of sharing | ❌ Limited | ⚠️ Possible | ⚠️ Possible | ✅ Easy | ✅ Built for sharing |
| Technical Skill Required | ⚠️ Low–Moderate | ⚠️ Moderate | ❌ High | ⚠️ Moderate | ✅ Low |
| Time to Value | ✅ Fast | ⚠️ Moderate | ❌ Slow | ❌ Slow | ✅ Fastest |
Curious to try out yourself? Sign up for free and start building your Zabbix dashboards today. Happy dashboarding!
DevRel Engineer, SquaredUp & Microsoft MVP

Getting started with SquaredUp is free and easy. Our free tier includes: