
Ready to unlock insights?
Our free tier includes:
- 2 users
- 3 data sources
- 10 monitors
- Unlimited dashboards
Our free tier includes:
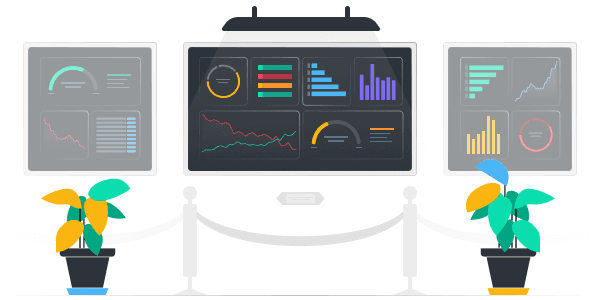
See our smart dashboards in action. Real-life use cases and example dashboards, brought to you by the SquaredUp community.

How we helped a major US manufacturing company pull data from different tools into one highly customized DORA metrics dashboard.

This dashboard displays key KPIs for support tickets over the last 7 days. You can easily report service desk stats to the business without giving individuals Zendesk access.

A CTO Overview dashboard to give the CTO and engineering management team a high-level view of the availability and performance of our SquaredUp SaaS application.

These eight out-of-the-box Azure cost monitoring dashboards allow you to effortlessly aggregate and visualize Azure spend across multiple regions and accounts – and even across multiple clouds or hybrid architectures.

Our Director of Engineering Services at SquaredUp, Tim Wheeler, gives us a walkthrough of how we use SquaredUp dashboards internally to monitor our Azure DevOps pipelines.

Get full oversight of your DORA metrics with this step-by-step guide on how to build a DORA metrics dashboard in SquaredUp.

Use custom telemetry and SquaredUp dashboards to get otherwise hidden insights on agent and user behavior.

Pipeline monitoring sounds simple - until it isn’t. Tim Wheeler shares how the SquaredUp team handles Azure DevOps releases at scale.

Azure DevOps tracks everything, but without the right view, you're flying blind. SquaredUp's pre-built dashboards bring it all together.

See all your security & code-quality metrics in one place with SquaredUp.

This dashboard is for MVPs to help them track multiple engagements and channels they contribute to and measure impact and reach.

Track Azure DevOps build health with SquaredUp