Sameer Mhaisekar
DevRel Engineer, SquaredUp & Microsoft MVP

Getting started with SquaredUp is free and easy. Our free tier includes:
Use custom telemetry and SquaredUp dashboards to get otherwise hidden insights on agent and user behavior.
DevRel Engineer, SquaredUp & Microsoft MVP
Here at SquaredUp we’ve built a Copilot Studio agent connected to our Zendesk organization that answers questions about support tickets in Teams. To know whether it’s actually helping people, we needed to measure real adoption and user trust, not just raw interaction counts.
Copilot Studio’s built‑in Analytics tab and the Azure “Agents” view in Application Insights give a good starting point: high‑level usage stats, AI summaries, and basic telemetry. But they don’t tell the full story. They don’t make it easy to see “soft failures” (hallucinations, “I don’t know” answers, irrelevant responses) or how different topics are really being used in practice. Those subtler issues determine whether the agent is genuinely accepted by users.
To close that gap, I started capturing richer, custom telemetry from Copilot topics into Azure Application Insights and built a SquaredUp dashboard on top of that data. The dashboard is powered by KQL over the CustomEvents table, plus a few extra events I log from the agent’s topics to surface the “hidden” signals.
SquaredUp was an obvious choice because:
This article walks through that dashboard and shows how we use SquaredUp to monitor our Copilot agent’s performance and behavior far beyond the out‑of‑the‑box analytics.
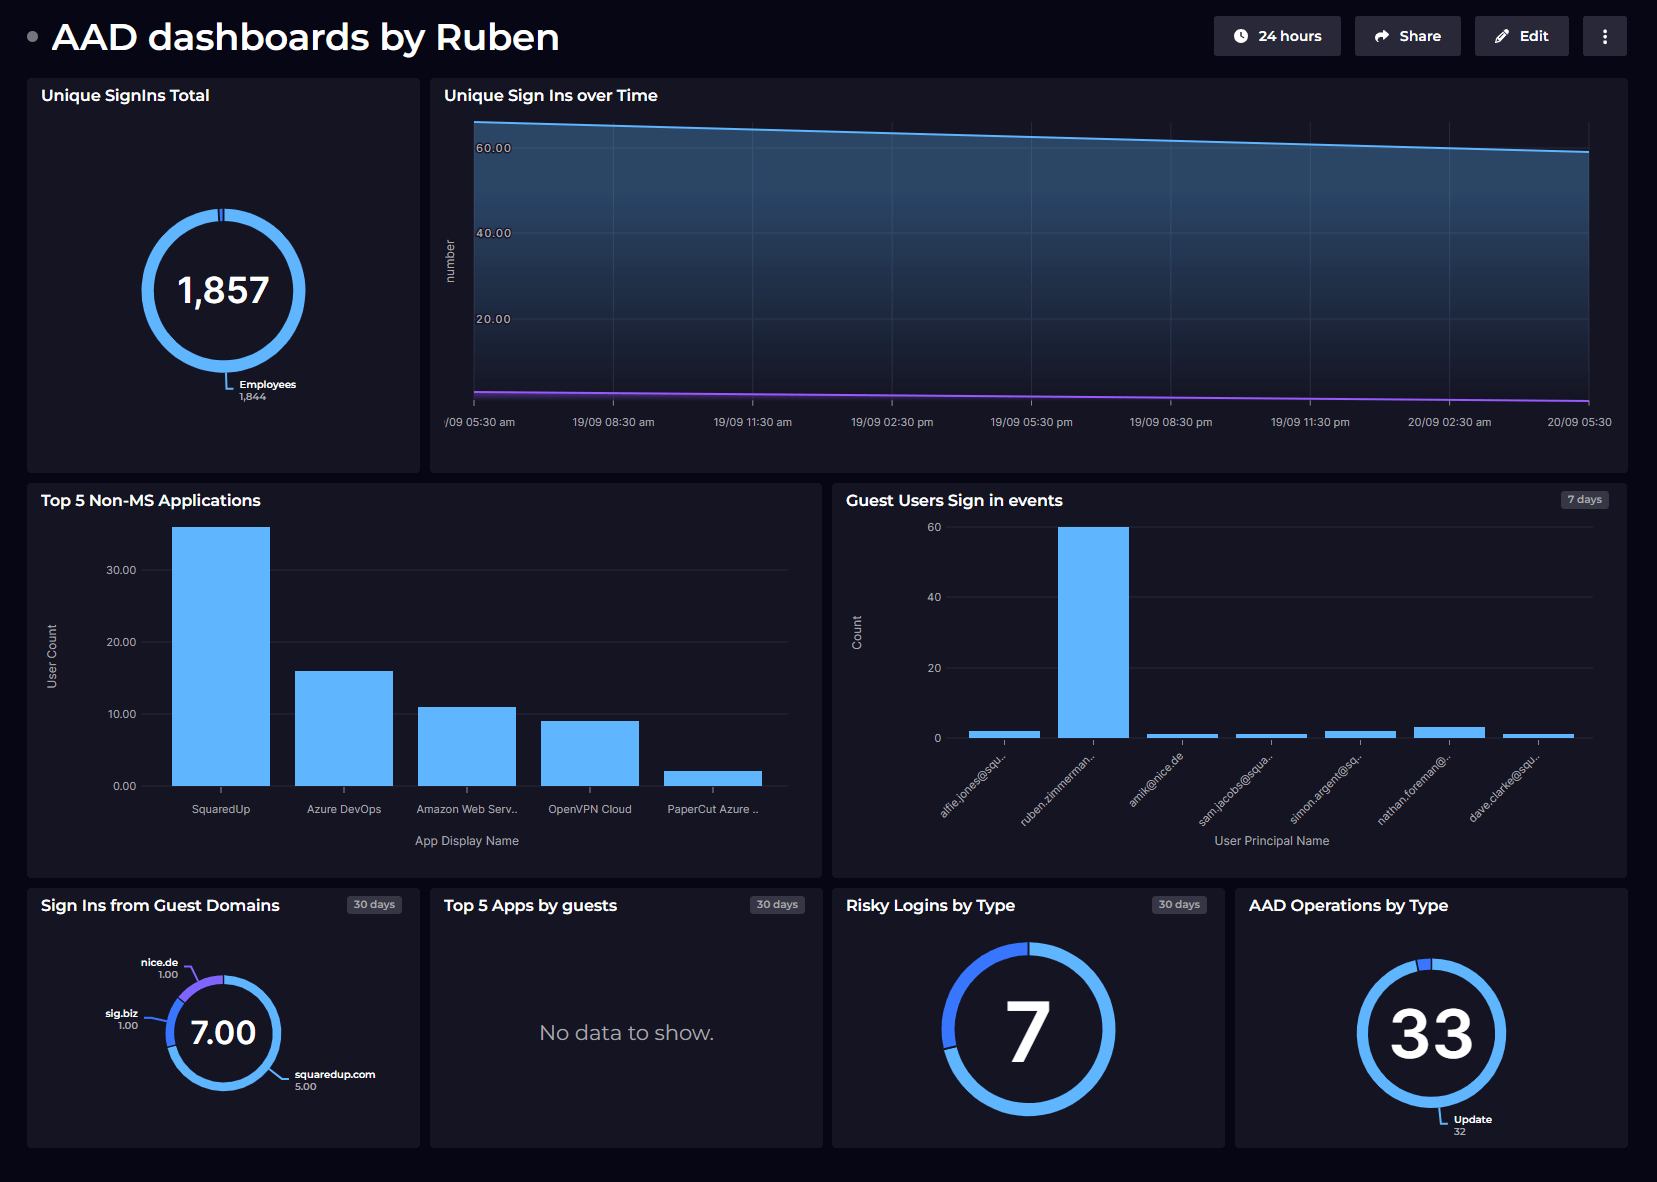
This is the dashboard:

The dashboard is entirely based on KQL queries (the data we need is logged in the CustomEvents table). This data is also captured in the Azure dashboards.
However, you will also notice that some tiles are based on custom telemetry that I put in. For example,
Hard Errors captures the instances when the agent operation yielded an error to the user on query. Like the following:

However, the “Soft failures” is when the agent cannot answer the question asked because it is not grounded on that data, not necessarily an indication of an “error” like the previous instance. For this, I have an event that captures pre-configured agent response “Sorry I don’t know that” and logs it. Like the following instance:

There’s another tile at the bottom right - “Topics most called” - that will enable you to track how the agent is working in the back to answer queries. If you have custom topics (and I suggest that you do!), based on what they’re configured to do, you will be able to gauge the user interactions and hence imply the “true acceptance” of the agent.
To hear more about SquaredUp and sign up, head over to SquaredUp - Smart dashboards. Total visibility.
Visualize and monitor data from Azure KQL queries.