Tim Wheeler
Director of Engineering Excellence, SquaredUp

Azure DevOps has become a cornerstone for development teams, providing comprehensive tools for managing, planning, and delivering software projects. However, effective project management isn’t just about setting up pipelines and managing repositories; it’s about measuring progress and making data-driven decisions.
Here’s a look at three powerful tools for reporting Azure DevOps metrics: SquaredUp, Azure DevOps built-in dashboards, and Power BI. Before we do a deep dive of the products, here's a summary of our findings:
SquaredUp: Offers a balance of user-friendliness and powerful visualizations, making it a good choice for teams of all sizes seeking rich dashboards without deep technical knowledge. It may not suit users needing extremely custom data analysis from scratch, but its smart dashboarding tool provides efficient Azure DevOps monitoring
Azure DevOps built-in dashboards: These dashboards offer easy, real-time insights within the Azure DevOps platform, which is great for smaller teams. However, they have limited customization options and lack cross-project visibility.
Power BI: This tool provides advanced analytics and extensive customization, which makes it suitable for large organizations needing complex reporting. Its downside involves a steeper learning curve and the need for a separate license, which can be costly.
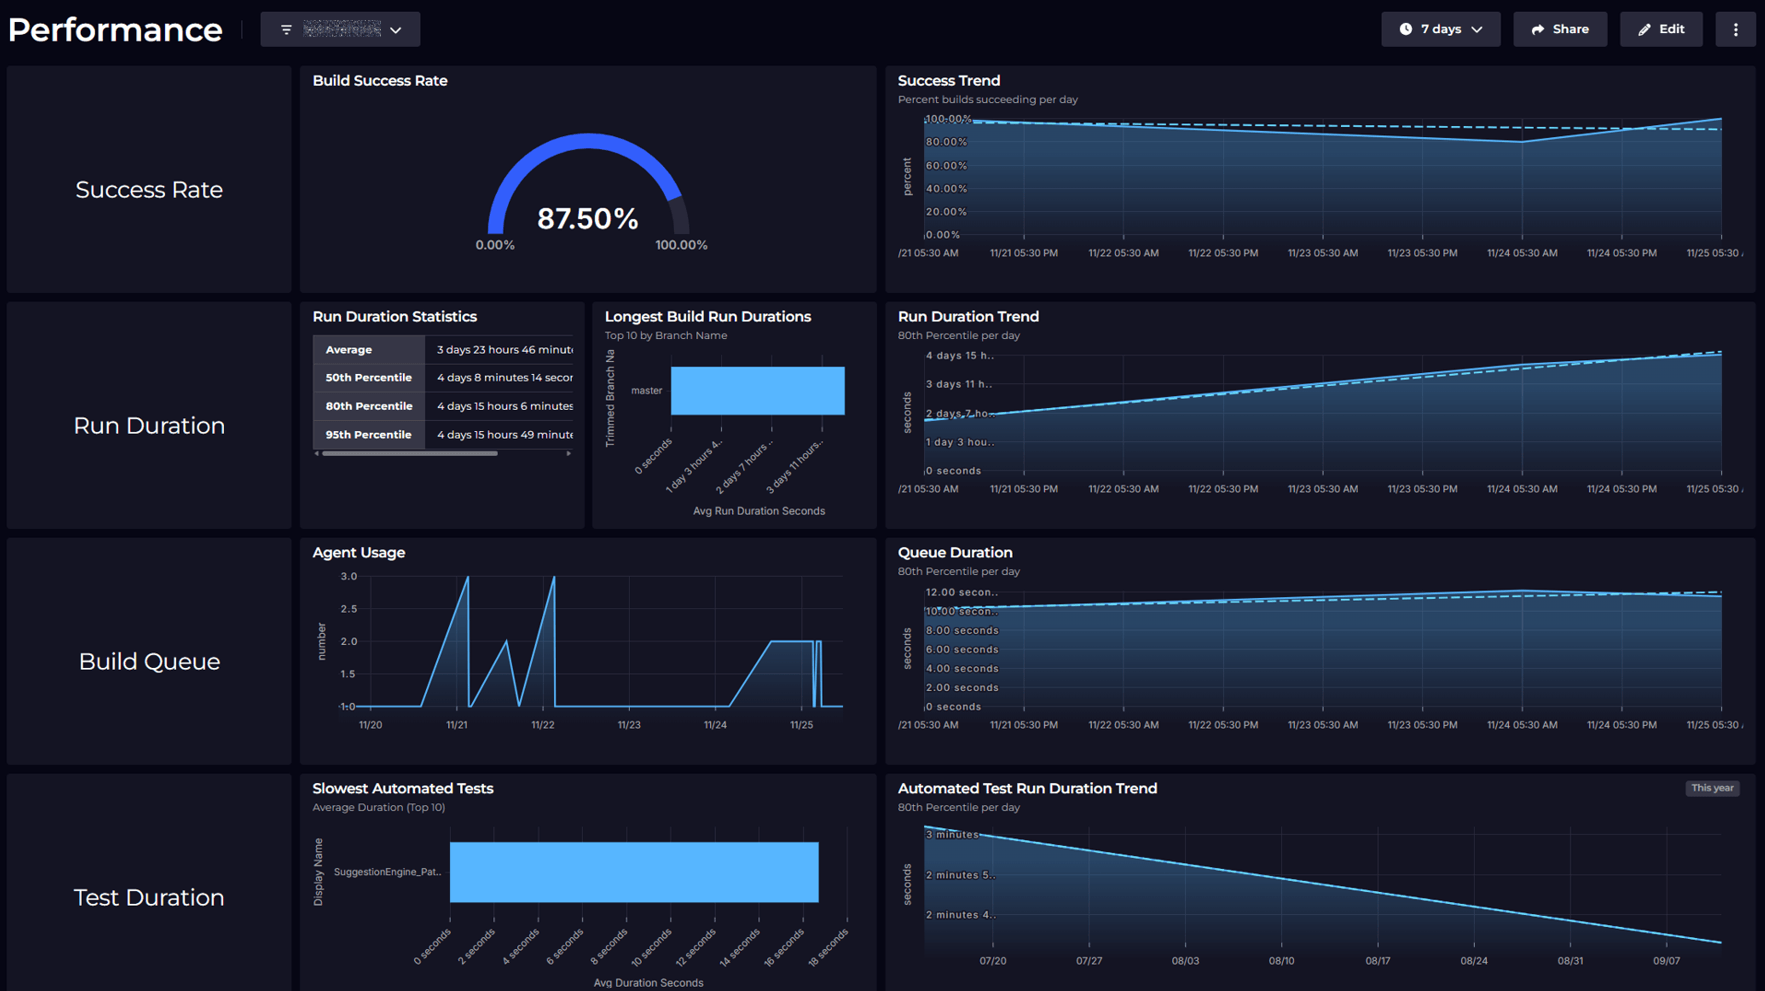
SquaredUp is a third-party dashboarding tool that integrates seamlessly with Azure DevOps offering powerful, user-friendly visualizations and insights into development processes and project metrics.
It is particularly known for its ability to surface complex data in a clear, understandable manner, and for its out-of-the-box dashboards that are automatically populated with Azure DevOps data.
SquaredUp stands out as a user-friendly, efficient solution for Azure DevOps monitoring, offering a balance between ease of use and powerful visualization capabilities.

SquaredUp is ideal for teams that need to integrate Azure DevOps data with other tools for comprehensive monitoring - as well as those looking for an easy-to-use, visually rich dashboarding solution that doesn’t require deep technical knowledge to set up and maintain.
Users who prefer building dashboards from scratch using raw data or require extremely complex, custom data analysis beyond standard DevOps metrics might overlook SquaredUp’s smart dashboarding tool.
Azure DevOps comes with built-in dashboards that allow teams to visualize metrics directly within the platform. These are especially useful for teams already invested in the Microsoft ecosystem or working primarily with Azure-based services. These dashboards provide a range of widgets that can display data such as work item progress, build status, code coverage, and more.

Built-in dashboards are ideal for single or small teams that need quick, real-time insights directly within Azure DevOps without the need for complex setup or external tools. Teams working on projects with frequent releases or those practicing agile methodologies find these dashboards particularly valuable for tracking velocity, burndown rates, and work item status. They are particularly favored by organizations with a mix of technical and non-technical users, as the dashboards provide a user-friendly interface for visualizing complex data.
Azure DevOps built-in dashboards may not be the ideal solution for teams that require highly customized or complex data visualizations that go beyond the capabilities of the available widgets. Additionally, organizations that operate in multi-cloud environments or use a diverse set of tools outside the Microsoft ecosystem might find these dashboards limiting in terms of data integration and cross-platform visibility.
Power BI is a robust business analytics tool by Microsoft that can connect to Azure DevOps for advanced reporting. It allows you to create rich, interactive reports that can provide deep insights into your DevOps processes.

One of the key strengths of Power BI is its ability to connect to various data sources, including Azure DevOps, through its native connector or OData feeds. This integration allows teams to extract valuable information from their Azure DevOps projects, such as work item data, sprint progress, and team velocity. This makes it ideal for organizations that require deep, data-driven insights into their DevOps processes and want to combine this data with other business metrics for comprehensive reporting.
However, it's worth noting that Power BI's integration with Azure DevOps does have some limitations. For instance, the native connector currently only supports Azure Boards data and doesn't provide access to other Azure DevOps features like pipelines. Additionally, setting up Power BI for Azure DevOps reporting may require some technical expertise, especially when dealing with rich text fields or creating dynamic queries.
| Feature | SquaredUp | Azure DevOps Built-in Dashboards | Power BI |
| Ease of Setup | Easy, direct integration | Easy, native integration | Moderate, requires connector setup |
| Customization | Moderate to High | Limited | Extensive |
| Real-time Data | Yes, always up-to-date | Yes | Dependent on refresh settings |
| Cross-project Visibility | Yes, out-of-the-box | Limited | Possible with advanced setup |
| Data Visualization | Rich and user-friendly | Basic | Advanced |
| Learning Curve | Low to Moderate | Low | High |
| Integration with Other Tools | Good, supports multiple tools | Limited to Azure DevOps | Extensive |
| Cost | Separate license, but cost-effective | Included with Azure DevOps | Separate license required |
| Suitable for | Teams of all sizes, comprehensive DevOps insights | Small teams, basic reporting needs | Large organizations, complex analytics |
When it comes to reporting Azure DevOps metrics, the right tool depends on your specific needs and technical capabilities. Azure DevOps built-in dashboards are great for quick, real-time insights. Power BI offers advanced analytics and visualisation options for more complex reporting needs.
SquaredUp strikes a balance between ease of use and powerful visualizations, making it a solid choice for teams looking to create informative and engaging dashboards without a steep learning curve.
By understanding the strengths and limitations of each tool, you can make a more informed decision about the one that best fits your organisation's reporting needs, helping to drive better outcomes from your Azure DevOps processes.
If you're looking for a visually rich, easy-to-use dashboarding solution, start a free trial of SquaredUp today.
Director of Engineering Excellence, SquaredUp


Getting started with SquaredUp is free and easy. Our free tier includes: