Bruce Cullen
Director of Products, SquaredUp

Big news! Microsoft have just dropped Azure Monitor SCOM Managed Instance (SCOM MI), their cloud-based version of SCOM.
It’s fully Microsoft managed, and so it promises to take the headache out of deploying, scaling, and managing your SCOM Management Groups.
Read Microsoft’s announcement blog to learn all about it.
If you’re considering migrating to SCOM MI, here are three reasons you should:
To celebrate this highly anticipated release, we’ve partnered with Microsoft to bring you our dedicated SCOM MI plugin, a tailor-made solution for SCOM MI reporting.
Read on to learn:
With SquaredUp’s 60+ plugins, you can visualize your SCOM MI data alongside VMware, SolarWinds, Zabbix and more, for the ultimate single pane of glass.
See everything you need to proactively monitor performance, availability, capacity, and much more, all in one unified view.
Unlike other observability platforms, SquaredUp connects directly to the APIs of your tools, instead of copying the data into yet another database. You can keep costs down and get instant results, all without maintaining data pipelines.
Just point and click to build custom, flexible dashboards without the need for complex queries or analyst expertise.
Here’s five ways SquaredUp can elevate your SCOM MI reporting:
Before connecting to SquaredUp, you’ll need to get set-up with SCOM MI. Microsoft has a detailed step-by-step guide on how to do that here.
Once you’re set-up, follow these simple steps:
Please note, SquaredUp is also listed in Azure Marketplace.
Once you’ve created and verified your account, you’ll be able to quickly connect to SCOM MI and start dashboarding! Let’s walk through the process.
Upon creating your SquaredUp account, you’ll land in an empty workspace where you’re prompted to add a data source. For context, workspaces are where different teams can organize their data across the tools they use, so feel free to leverage this feature as you expand your monitoring.
Click “add a data source” and choose from over 60 options. You can search for SCOM Managed Instance using the search bar at the top or browse using the filters on the left-hand side.
Once selected, you’ll be prompted to enter the following details:
This is automatically added to help you identify this data source in the list of all data sources connected to your workspace.
Enter the database name of the SCOM MI data warehouse. This value can be found in the Reports section of the SCOM MI instance.
The URL of the SCOM MI database server. This value can be found in the Reports section of the SCOM MI instance. Keep the comma and port after the URL.
Enter the username of a SQL account to logon to SCOM MI. The username must have data warehouse reader permissions to access SCOM MI data.
Enter the password of the SQL account.

To see your live data automatically loaded up in our SCOM MI out-of-the-box dashboard, simply hit the bottom toggle “Install Sample Dashboards”.
For more detail on connecting the SCOM MI plugin, read our documentation.
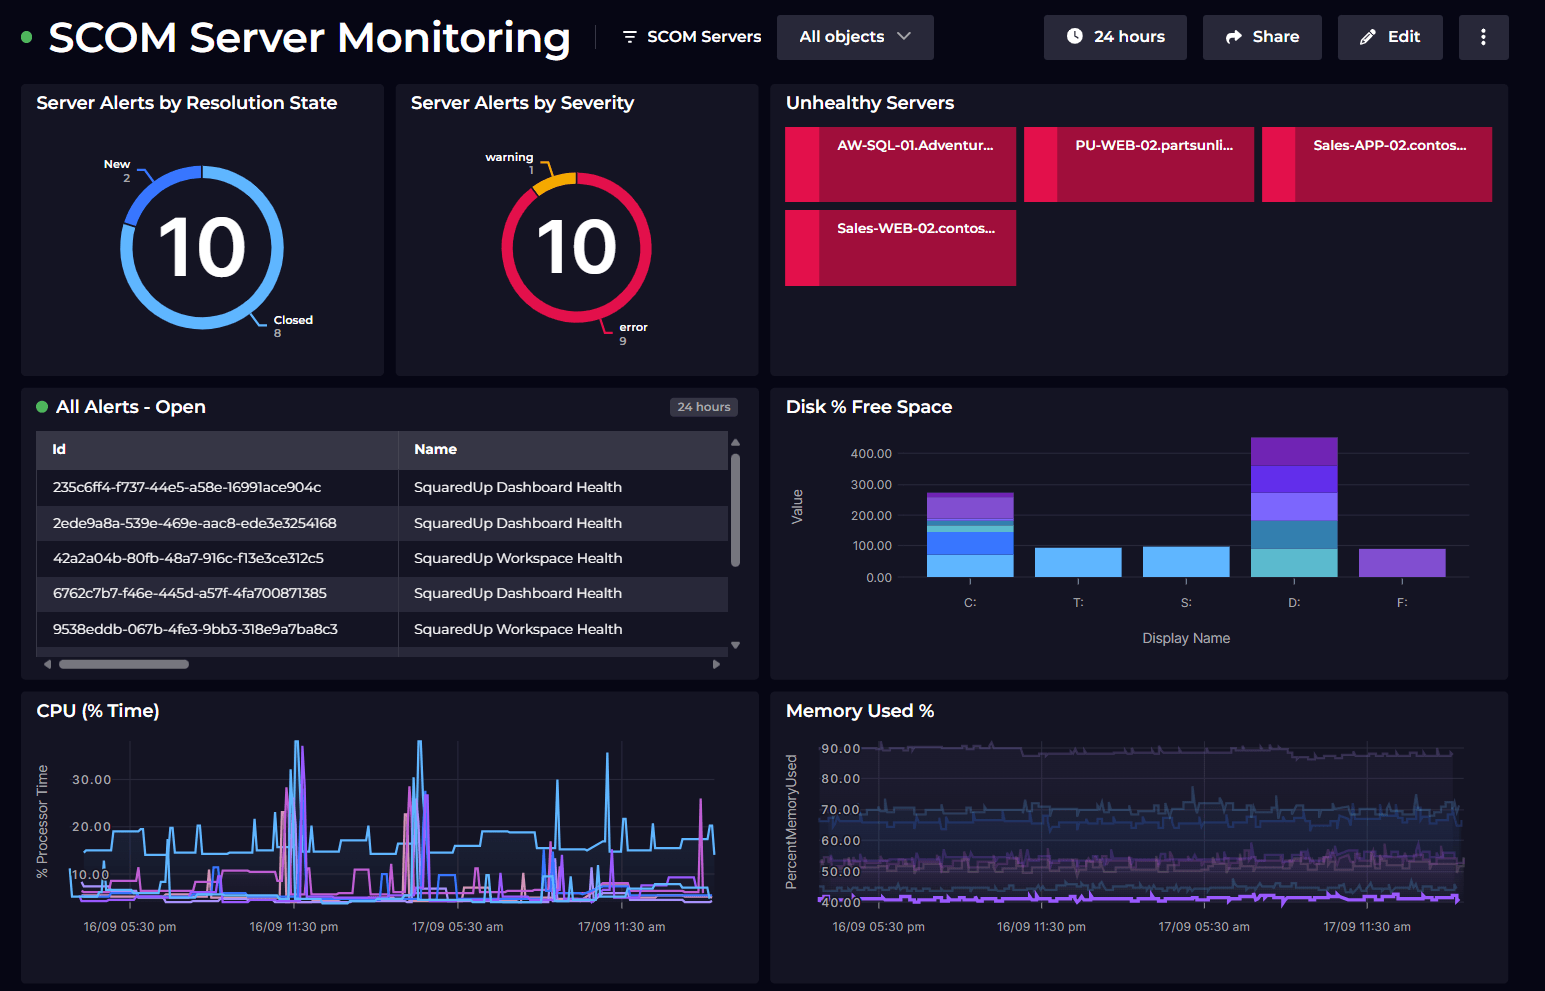
Out of the box dashboard: Health Overview
This provides a summary view of your open alerts, state and performance from SCOM MI.
Customize your dashboard
This out-of-the-box dashboard can easily be edited to make it your own. Simply hit the “edit” button in the top right.
Hover over an empty space on your dashboard and click the '+' to add a new data, image, or text tile.
To edit an existing tile, simply click ‘edit’ in the top right to add monitoring, KPIs and more.
Build your own custom dashboard
If you’d like to build your own custom dashboard, our revamped dashboard designer now makes it even easier. Find the metric you're looking for, shape the data, configure your visualization and add monitoring, all in a few clicks.
The tile editor allows you to configure the data from your data sources and display it in any way you wish. Steps may vary depending on which data stream you select.
Let’s start building a dashboard.
In the left nav bar, click the ‘+' sign next to the 'Dashboards’ tab.
You can add a title and description for your tile at the top of tile editor.
There are three tile types to choose from: Data, Image or Text. For the purpose of this example, let's start with Data.

Configure the tiles on your dashboard by choosing the following:

The visualization options are shown on the right of the dashboard designer. Which visualizations are offered to you depends on the data available, for example Line Graph will only be offered if there is time series data.

Customize your tiles even further by sorting, filtering or grouping the data, and setting custom timeframes.
See how SquaredUp Product Manger, Dave Clarke, uses the beautifully simple dashboard designer to create an AWS dashboard visualization in under a minute:
Getting a dashboard up and running is a great start, but it’s just that... a start.
SquaredUp has many features that enable you to get so much more mileage out of its native integration with SCOM Managed Instance.
All the best, and happy dashboarding!
Director of Products, SquaredUp


Getting started with SquaredUp is free and easy. Our free tier includes: