John Hayes
Observability Advocate, SquaredUp
If you are involved in software development you will probably be aware of the ever-growing menace of supply chain attacks. These are attempts by attackers to insert malicious code into code libraries which might be downloaded or referenced by developers. Many modern frameworks can install hundreds or even thousands of dependencies, so the potential attack surface can be huge. As well as code libraries, attackers can also attempt to conceal malware in sources such as Docker images or CDNs.
Keeping track of potential vulnerabilities is a task that can only be carried out by automated tooling. This is where applications like Snyk come in. They can connect to your code repos or sources such as Docker images and scan for potential threats and vulnerabilities.
Naturally, it you are involved in the software engineering process, you will have a whole battery of tooling delivering all kinds of metrics and insights on builds, deployments, application performance, security and more. With SquaredUp you can bring all of these insights together under a single pane of glass.
Getting started with the SquaredUp Snyk plugin is a cinch.
To get started, just generate an API Key in your Snyk account. You can find details on doing this here.
If you don't already have a SquaredUp account don't worry – just sign up for our Free Forever tier and you can get started in just a few minutes.
Connecting to your Snyk account in SquaredUp could not be simpler. In SquaredUp, just add a new dashboard and then select the Snyk data source:

To add the data source all you need to do is enter your Snyk APi Key and then click on the blue Test and add button.

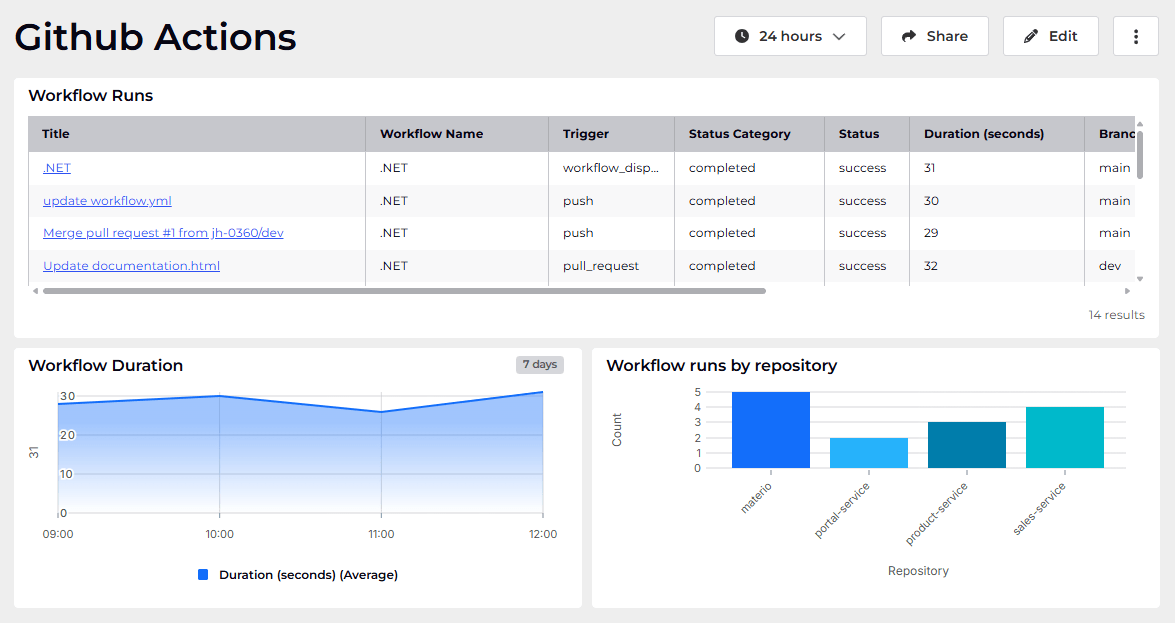
SquaredUp will now connect to your Snyk account, and configure data streams – these represent the different kinds of entities that can be queried in a particular data source:

That's it! We can now explore the Snyk dashboard that SquaredUp generates automatically upon connecting to your data.

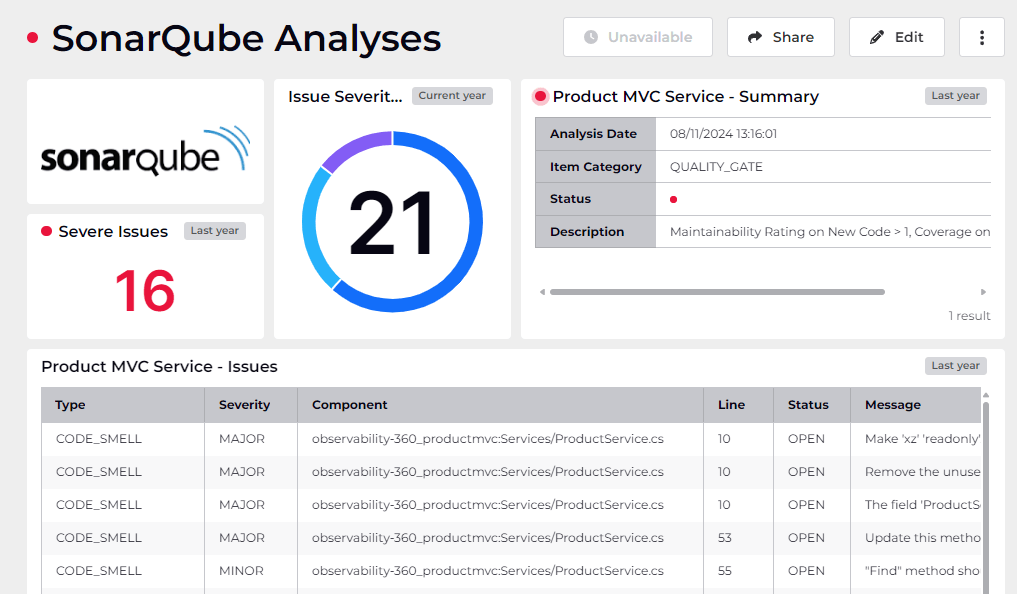
As you can see above, the SquaredUp plugin has successfully retrieved a set of analytics from Snyk. We can see issues summarized by category as well as a table listing the detail of each individual issue. On the right hand side of the dashboard we can see a bar chart showing the time to resolve issues. One of the cool features of Snyk is that can automatically generate Pull Requests to upgrade vulnerable dependencies to a safe version. Once the PR is completed, this chart will be updated.
Of course, at SquaredUp our dashboards are not just snapshots, they are context-aware and equipped with the tools to help stakeholders act on the data that they surface. As an Engineering Manager you might only be interested in the number of Critical Severity issues. With SquaredUp, you can apply a Monitor to a field in your data so that if its value crosses a particular threshold its health status is updated. These health statuses can then be monitored in higher level Workspace or Organisation dashboards.
I would like to add a Monitor for Critical severity issues. To do this, click the Edit button at the top of your dashboard and then click on the pencil icon to edit the Critical Severity Issues tile:

On the right hand panel click on the Monitoring tab and enable monitoring by moving the slider control to the right. Our logic is that if the count of Critical Severity Issues is greater than zero, then the monitor should enter an error state. We therefore select Count as our Value and Critical Issue Count as our Evaluate by field. We can just accept the default values for Conditions.

Once you click on Save you will see that the Critical Severity Issues tile now displays a pulsing red dot to indicate an error state. You will also see that the Monitor has bubbled up to our Team Workspace.

This means that Engineering Managers can easily see all monitors across a workspace in one consolidated view. That's not all you can do though. In SquaredUp you can also generate KPIs from your monitors as well as being able to create alerts.
With SquaredUp you can also easily share your dashboards – even with users who do not have a SquaredUp license. Clicking on the Share button at the top of your dashboard will give you a number of options for sharing and managing permissions:

If you don’t have a SquaredUp account, no worries! You can sign up for our Free Forever tier and get dashboarding right away.
Observability Advocate, SquaredUp


Getting started with SquaredUp is free and easy. Our free tier includes: