John Hayes
Observability Advocate, SquaredUp
One of the most interesting stories in the dashboarding space over the past year or so has been the emergence of the Perses project. This is an open source project which not only provides a platform for dashboard creation, but also sets itself the very ambitious target of defining a common standard for dashboards as code.
As a SquaredUp user, you may be wondering why we might want to talk about a potentially competing technology. Well, obviously, being SquaredUp, dashboards are in our DNA. We also think that there are numerous dashboarding technologies, each with their own particular specialisms and having a standard which enables sharing can be a benefit for all.
We think that there is probably a good deal of curiosity about Perses, but, as yet, there are not many articles providing detail on how the concept of dashboard interoperability might actually work in practice. In this article therefore, we will start with a general overview of the Perses architecture and then go on to look at a simple example of generating a Perses compliant dashboard and importing it into a Perses server.
As well as defining a dashboard specification, the Perses project also includes an open source SDK as well as a platform for creating and hosting dashboards – in much the same way that you might design and run dashboards in tools such as SquaredUp or Grafana. You can either use the Perses cloud service or you can spin up your own self-hosted instance of the Perses platform running in Docker or Kubernetes.
The architecture therefore consists of the following components
The API is the central mechanism for facilitating interoperability with the Perses platform. You can build your dashboards in a tool such as Go and then upload them to the Perses server via the API. The Perses CLI provides another method of interacting with the API if you don't wish to use the REST interface.
As we have said previously, Perses defines a standard for specifying the structure of a dashboard. This means that, if we follow the specification, we can create a dashboard in the tooling of our choice and then display it in any Perses compliant server. Just as the HTML specification defines the elements of a web page, as well as the rules for ordering and nesting those elements, Perses defines a similar structure for a dashboard. You can find the specification here.
Not surprisingly, the top-level entity is the dashboard. Nested within this are elements such as data sources, variables and panels. Within each panel you then specify what type of visualisation you would like – i.e. a time series chart, bar chart etc as well as other instructions such as the query for retrieving your data. Below is a simplified representation of a Perses dashboard structure:
Dashboard
├── Title: "Dashboard Name"
├── Data Sources
│ ├── Data Source ID: "prometheus-1"
│ │ ├── Type: "Prometheus"
│ │ ├── URL: "http://example.com"
│ │ └── Authentication (optional)
|─- Layout (Grid)
│ ├── Row 1
│ │ ├── Panel 1 (e.g., Timeseries)
│ │ ├── Panel 2 (e.g., Gauge)
│ │ └── Panel 3 (e.g., Stat)
├── Panels
│ ├── Panel ID: "panel-1"
│ │ ├── Title: "Panel Title"
│ │ ├── Type: "timeseries" | "gauge" | "stat" | etc.
│ │ ├── Data Source: "prometheus-1"
│ │ └── Queries
│ │ ├── Query 1
│ │ └── Query N
│ └── Panel ID: "panel-2"
│ ├── Title: "Another Panel Title"
│ ├── Type: "gauge"
│ ├── Data Source: "custom-ds-1"
│ └── Queries
│ ├── Query 1
└──
Ok, that's the theory – how does this all hang together in practice? Let's walk through getting a local instance of Perses up and running, creating a simple dashboard in code and then uploading it to our Perses instance. For this article we will be running all of our code on a Windows 10 PC.
If you are using Windows then successfully building and running the Perses source code and binaries can be problematic. We are therefore just going to run it as a Docker container. To do this, all you need to do is run this command in your terminal:
docker run -p 8080:8080 persesdev/perses
If the command succeeds you see an output like this in your terminal:

If you now browse to this url:
http://localhost:8080
you will see the Perses UI:

In Perses, dashboards are organised into Projects and, as you can see, we have not yet created any projects. We could obviously manually create a project in the UI, but we are going to create ours by making a request to the Perses Web API. In our terminal, we are going to run the following Curl command:
curl -X POST \
http://localhost:8080/api/v1/projects \
-H "Content-Type: application/json" \
-d '{
"kind": "Project",
"metadata": {
"name": "Project1"
},
"spec": {}
}'
As you can see, the command is making a HTTP POST request to submit a JSON payload to the project's endpoint of the Perses API. If the command is successful, you will see a response like the one below:

If we refresh the web UI in our browser, we will also see that the project is now listed:

We have a number of options for creating the code for our dashboard. The most basic option is obviously to code everything by hand. This would be tedious and error-prone. A second option is to create the dashboard manually in Perses and then export the dashboard definition. In this walkthrough we are going for the third option, which is to use the Perses library that has been developed for use with the Go programming language. This is a great option for familiarizing ourselves with the rules and syntax of Perses without having to digest every detail of the spec.
Obviously, if we are going to create a dashboard, we need a data source that can provide some data. At the moment, the Perses server will only work with a Prometheus data source. We will therefore spin up a Prometheus instance in Docker. To do this we just need to run the following command:
docker run -p 9090:9090 prom/prometheus
Once the container is running, we will run the following command to retrieve its IP address:
docker inspect \ --format='{{.NetworkSettings.IPAddress}}' \ <container_name_or_id>
we will be using this IP address as a data source in our dashboard
Prometheus is written in the Go programming language and when the server starts it will automatically emit metrics about the performance of the Go Garbage Collector - and we will use these as the data for our dashboard.
The first thing we need to do is fire up VS Code and create a new folder for our dashboard project. Next we need to initialise our Go module. Navigate to the path for your project in your terminal and type:
go mod init perses
Next, we need to retrieve the Go SDK for Perses:
go get github.com/perses/perses/go-sdk
Next, we will create a new file in VS Code called dashboard.go: and then paste in the code below:
package main
import (
"flag"
"github.com/perses/perses/go-sdk"
"github.com/perses/perses/go-sdk/dashboard"
"github.com/perses/perses/go-sdk/panel"
panelgroup "github.com/perses/perses/go-sdk/panel-group"
"github.com/perses/perses/go-sdk/prometheus/query"
timeSeriesPanel "github.com/perses/perses/go-sdk/panel/time-series"
promDs "github.com/perses/perses/go-sdk/prometheus/datasource"
)
func main() {
flag.Parse()
exec := sdk.NewExec()
builder, buildErr := dashboard.New("PrometheusStats",
dashboard.ProjectName("project1"),
dashboard.AddPanelGroup("GoStats",
panelgroup.PanelsPerLine(3),
panelgroup.AddPanel("Garbage Collection",
timeSeriesPanel.Chart(),
panel.AddQuery(
query.PromQL("go_gc_duration_seconds_count"),
),
),
),
dashboard.AddDatasource("promDocker", promDs.Prometheus(promDs.HTTPProxy("http://<your-container-ip-address>:9090"))),
)
exec.BuildDashboard(builder, buildErr)
}
Let's break down the code a bit. First of all, we have a block where we import the libraries we need from the Perses SDK. Next, we create a dashboard object. Once the dashboard object is created, we add a panel and define a chart and a query. The query is simply the name of the metric we wish to retrieve (go_gc_duration_seconds_count). We then define a data source for our dashboard - this will point to our Prometheus instance.
This line of code:
exec.BuildDashboard(builder, buildErr)
will build the YAML for our dashboard and write it to the stdout channel.
Now, from our command line, we will run a command to build the dashboard and output the text to a file called dashboard.yaml:
go run dashboard.go > dashboard.yaml
Before we upload our dashboard to the Perses server we are going to convert it to JSON. To do this, we are going to use the Yaml Plus Json plugin, which you can install from the Visual Studio Market Place at https://marketplace.visualstudio.com/items?itemName=hilleer.yaml-plus-json.
Once you have installed the plug-in just right click on your dashboard.yaml file and select the Convert to Json option. As well as converting the YAML to JSON, the plugin will also change the extension of the file from .yaml to .json.
Next, we will run a Curl command to upload the dashboard JSON to our Perses project:
$ curl -X POST http://localhost:8080/api/v1/projects/project1/dashboards -H "Content-Type: application/json" -d @dashboard.json
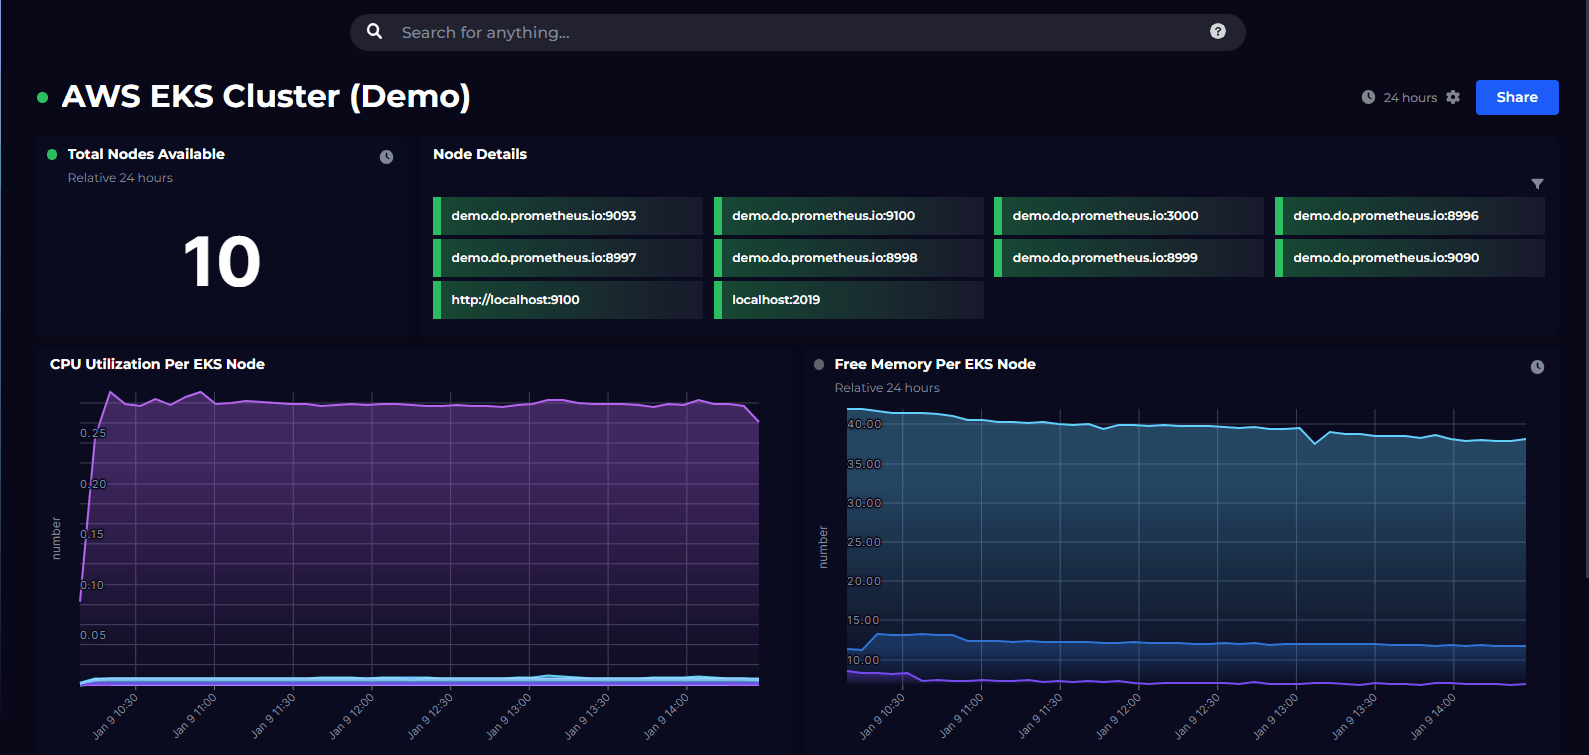
If we now go back into our project in the Perses UI we can see that the new dashboard is listed:

When we click on the dashboard link, we can see our simple dashboard showing some Go garbage collector stats from our local Prometheus instance.

As a SquaredUp user, chances are that you may not have to set up a Perses server or fire up an editor to compose a dashboard in code. At the same time, there may be occasions when you may need to import or export a dashboard. At SquaredUp we are taking a close interest in the Perses project and are working on functionality to import and export dashboards in Perses format.
The Perses project has set itself a very ambitious goal. Dashboards are shapeshifters, capable of taking on many different forms, with an almost infinite variety of representations. Finding a language to express all of the possibilities is a daunting task. At the moment the project is still in its formative stages and at the moment the only data source that the platform supports is Prometheus.
Of course, if you want to get started on building dashboards today, SquaredUp has integrations with over 70 data sources as well as being able to retrieve data from any Web API that supports JSON. If you haven't tried it out yet, sign up here and have your first dashboard up and running in minutes!
Observability Advocate, SquaredUp

Getting started with SquaredUp is free and easy. Our free tier includes: