Louise Berry
SquaredUp
The M365 suite is vast, and the mountains of data that accumulate within each application are huge and ongoing. While data reporting is a necessity, management can feel unwieldy.
Luckily, there is an array of reporting software on the market to support this challenge, and this blog will explore three powerful tools for M365 reporting: SquaredUp, Microsoft 365 Admin Center, and Power BI. Before we dive into the strengths and weaknesses of each one, here’s an overview of our findings to help inform your decision:
SquaredUp: offers a modern, intuitive solution for M365 reporting, leveraging its data mesh architecture to connect directly to Microsoft Graph API and over 100 other data sources. Its pre-built dashboards for SharePoint, Exchange Online, and Teams provide real-time insights and customizable visualizations tailored to business needs, making it an ideal choice for organizations seeking actionable data without the added complexity.
Microsoft Admin Center: provides basic insights into usage and activity across services like SharePoint, Teams, and Exchange Online. While sufficient for simple monitoring tasks, these tools lack advanced customization options and require manual effort to consolidate data across multiple reports.
Power BI: a robust business intelligence platform that integrates seamlessly with M365, offering advanced analytics and visualization capabilities. It does, however, have a steep learning curve and its reliance on user expertise can make it challenging for organizations seeking quick and straightforward reporting solutions.
With the key takeaways in mind, let's now take a closer look at each tool, examining their feature sets, integration capabilities, and overall suitability.
Whether it's monitoring user activity, maintaining security, keeping tabs on service performance, or meeting compliance standards, handling the M365 environment can be a tall order. Navigating the complexities of protocols, governance, and frameworks while maintaining optimal system performance is not possible without effective tools and strategic management. These three tools, in their own unique ways, could be a good choice for your requirements.

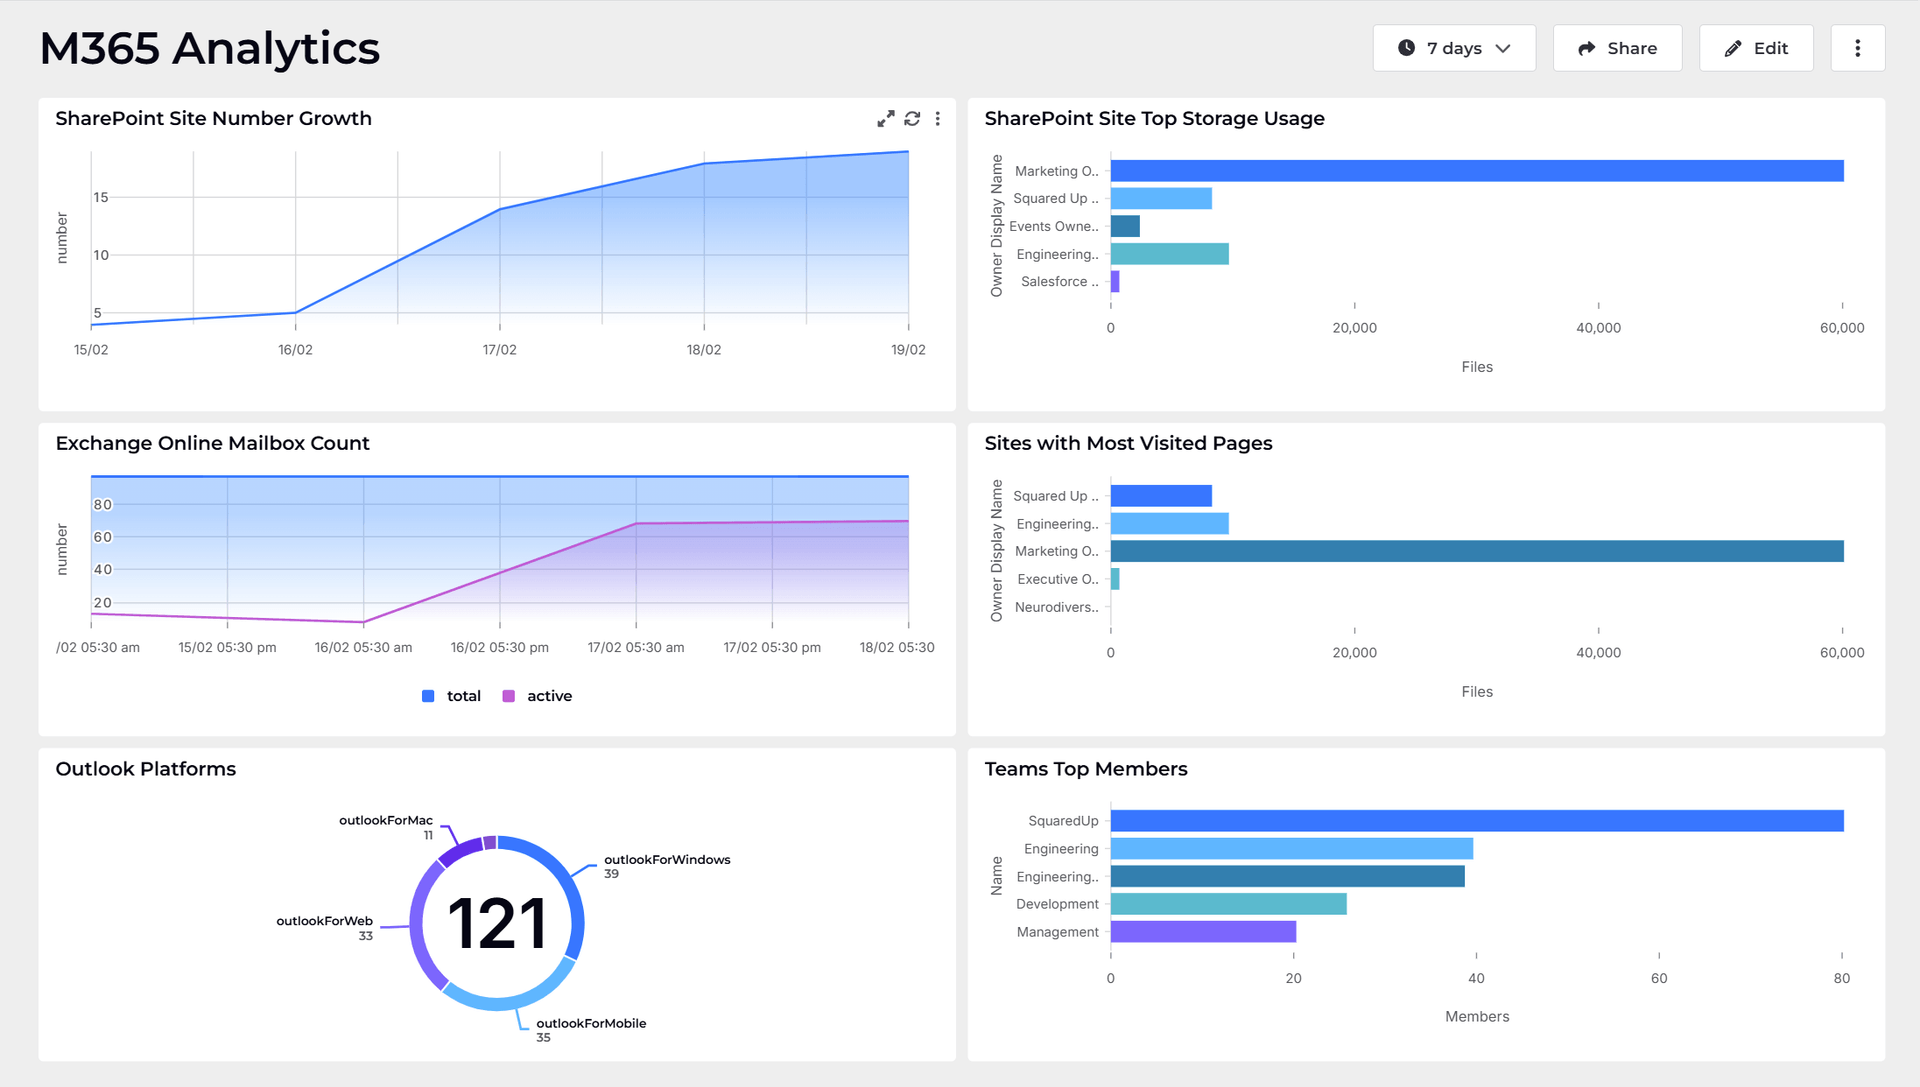
SquaredUp stands out as a smart dashboarding platform designed to simplify the visualization and monitoring of M365 data. Its M365 plugin enables users to analyze, visualize, and report on their Microsoft 365 usage and metrics through interactive dashboards.
Direct API integration: Instant access to M365 data without complex setup processes.
Ease of use: An intuitive dashboard designer allows admins to create custom views quickly without coding expertise.
Real-time monitoring: Enables proactive alerting and live updates for critical metrics like license allocation or compliance violations.
Sharing made simple: With one-click sharing, admins can distribute insights across teams effortlessly.
SquaredUp is a powerful dashboarding platform designed for IT teams, offering real-time monitoring and unified data visualization across multiple tools. However, like any tool, it has limitations that may impact its suitability for certain scenarios. Below are the key limitations, presented with a subtle emphasis on why SquaredUp remains a strong contender compared to Power BI and Microsoft’s native reporting tool.
SquaredUp is tailored for IT engineering teams and technical environments. It lacks mainstream integrations for business-wide use cases such as Finance, HR, or CRM systems. Organizations needing enterprise-wide business intelligence may find Power BI more suitable due to its broader data source compatibility.
SquaredUp does not store data; instead, it relies on its data mesh architecture to pull data in real-time from connected sources. If certain data streams are unavailable or incomplete within M365 or other integrated tools, SquaredUp cannot compensate for these gaps. For highly fragmented or inaccessible datasets, additional configuration may be required.
Unlike Power BI, SquaredUp does not offer advanced analytics capabilities such as predictive modeling, machine learning, or complex data transformations. Organizations requiring deep statistical analysis or forecasting may need to supplement SquaredUp with a dedicated BI tool.
Although SquaredUp offers an intuitive dashboard designer and pre-built templates, highly customized dashboards for niche use cases may require manual configurations or additional expertise. Despite this, its drag-and-drop dashboard creation and rapid setup (under 5 minutes) make it far easier to use than Power BI’s complex setup process.
While SquaredUp offers flexible pricing tiers (including a free plan), organizations with simpler reporting needs may find the subscription costs unnecessary if they already rely on free tools like Microsoft’s native reporting system.
In large organizations with highly complex IT ecosystems involving dozens of interconnected tools and teams, managing and maintaining dashboards across multiple environments can become challenging. Reporting across siloed teams requires manual effort to collect and unify data streams. However, its multi-tool integration capabilities allow organizations to centralize insights from fragmented systems into one unified view—something neither Power BI nor Microsoft’s native tool can achieve as effectively.
SquaredUp is particularly well-suited for organizations that need clear, real-time visibility across their M365 environment without the complexity of a full-blown BI solution. Its intuitive interface and pre-built dashboards make it a great choice for teams that want to quickly understand their M365 data and take action, without requiring extensive technical expertise or significant investment in setup and training.

Microsoft 365's built-in reporting capabilities offer a robust suite of features tailored for administrators seeking usage and compliance insights.
Reports Dashboard: For granular insights into email activity, SharePoint site usage, OneDrive activity, and more. Reports are available for timeframes of 7, 30, 90, and 180 days.
Microsoft Entra Reports: Offers advanced anomaly detection and resource usage analytics to help identify security risks. These reports can be exported to Excel for correlation with other M365 data.
Exchange Online Audit Reports: Tracks mailbox access, admin role changes, litigation holds, and external administrator actions.
Device Compliance Reports: Monitors mobile device security policies, compliance violations, and device wipes.
Data Loss Prevention (DLP) Reports: Provides insights into policy matches, overrides, and false positives for sensitive data protection.
While the reporting tool provides broad insights into usage, compliance, and security, it has several limitations that may act as dealbreakers to potential users.
Reports typically cover only the past 30, 90, or 180 days, making long-term trend analysis or historical comparisons difficult. Audit logs are retained for a maximum of 180 days, restricting investigations into older activities.
Many reports provide summarized data rather than granular details, which can make it challenging to drill down into specific user actions or activities. Tenant-level aggregated data is often the default view, limiting insights into individual user behavior or detailed auditing.
Some reports experience delays in data processing, impacting real-time decision-making and responsiveness to security incidents or operational issues.
Customization options are minimal; admins can only filter by basic parameters like date ranges or user groups. There is no support for predefined custom reports or advanced visualizations without third-party tools.
The reporting interface can be complex and overwhelming for non-technical users, requiring specialized training to interpret data effectively. Audit log searches require manual filtering each time, with limited search capabilities that complicate risk assessment and monitoring.
Reports are accessible only through Microsoft's native portals (e.g., Admin Center, Compliance Center), limiting integration with third-party systems or external analytics platforms. Organizations seeking broader interoperability may find the tool restrictive for combining M365 data with other systems.
Performance issues arise in environments with large datasets or more than 5,000 users, making the Compliance Center slow and unresponsive during high-demand reporting tasks.
Native reporting lacks proactive alerting features for critical events such as login failures or policy violations. Admins must manually monitor reports to detect issues.
Despite its limitations, the native tool has applications to a certain type of environment, specifically small to medium-sized businesses that have fewer users and simpler reporting techniques. Public sector workplaces focusing on compliance may also benefit from leveraging built-in compliance dashboards for audits and security monitoring.
While Microsoft 365's native reporting tool is functional for basic administrative tasks, its limitations—such as restricted historical data, minimal customization, delayed reporting, and scalability challenges—make it less suitable for organizations requiring advanced analytics or real-time monitoring. For enhanced reporting capabilities, administrators often turn to tools like Power BI or SquaredUp to overcome these shortcomings.
Power BI is a leading business intelligence tool that seamlessly integrates with Microsoft 365 to deliver advanced analytics and visualization capabilities.
Interactive dashboards: Create dynamic reports that can be embedded in Teams, SharePoint Online pages, or even PowerPoint presentations.
Excel integration: Analyze live Power BI data using familiar Excel tools, allowing admins to leverage existing skills.
Collaboration features: Share insights directly through Teams or Outlook to streamline decision-making processes.
Governance controls: Apply sensitivity labels and meet regulatory requirements using Microsoft Purview Information Protection.
Power BI excels at storytelling with data but may require significant expertise to design dashboards and manage integrations effectively.
While powerful, Power BI can demand significant time and expertise to fully leverage for M365 reporting. Its complex interface and advanced features may present a barrier for MSPs seeking a quick, straightforward solution.
Reports typically cover only the past 30, 90, or 180 days, making long-term trend analysis or historical comparisons difficult. Audit logs are retained for a maximum of 180 days, restricting investigations into older activities.
Many reports provide summarized data rather than granular details, which can make it challenging to drill down into specific user actions or activities. Tenant-level aggregated data is often the default view, limiting insights into individual user behavior or detailed auditing.
Some reports experience delays in data processing, impacting real-time decision-making and responsiveness to security incidents or operational issues.
Customization options are minimal; admins can only filter by basic parameters like date ranges or user groups. There is no support for predefined custom reports or advanced visualizations without third-party tools.
The reporting interface can be complex and overwhelming for non-technical users, requiring specialized training to interpret data effectively. Audit log searches require manual filtering each time, with limited search capabilities that complicate risk assessment and monitoring.
Reports are accessible only through Microsoft's native portals (e.g., Admin Center, Compliance Center), limiting integration with third-party systems or external analytics platforms. Organizations seeking broader interoperability may find the tool restrictive for combining M365 data with other systems.
Performance issues arise in environments with large datasets or more than 5,000 users, making the Compliance Center slow and unresponsive during high-demand reporting tasks.
Native reporting lacks proactive alerting features for critical events such as login failures or policy violations. Admins must manually monitor reports to detect issues.
Power BI is used by organizations that require advanced analytics, data modeling, and, more importantly, visualization. The latter is crucial for creating ‘what if’ scenarios and supporting decisions before full-scale implementation - and is something the native tool lacks. Power BI tends to be used in enterprise IT environments, multi-tool workplaces, and those with heavy-duty monitoring needs and round-the-clock operations.
Power BI is best suited for advanced analytics and cross-departmental reporting, but has notable limitations when used specifically for M365 reporting: its lack of real-time monitoring capabilities, and licensing constraints may not align with simpler M365 reporting needs. Users have also highlighted the tool’s Integration challenges and performance issues with large datasets, which have hindered efficiency.
Below is a detailed comparison of the three tools for Microsoft 365 reporting, highlighting their capabilities and advantages. While all tools are effective, SquaredUp emerges as the most user-friendly and efficient option for administrators.
Feature | SquaredUp | Microsoft Admin Center | Power BI |
|---|---|---|---|
Ease of Use | Intuitive, drag-and-drop interface; rapid setup (under 5 minutes). | Simple, but limited customization options. Requires navigating different admin centers. | Steeper learning curve; requires specialized expertise. Can be complex for users without a strong BI background. |
Data Connectivity | Data mesh architecture; connects directly to Microsoft Graph API and 100+ data sources. | Primarily focused on core M365 services. Limited external data source integration. | Strong data connectivity across a wide range of sources, but can require significant data transformation and modeling. |
Customization | Highly customizable dashboards and visualizations; wide range of tile types. | Limited customization; pre-defined reports with few options for modification. | Extensive customization capabilities, but requires significant time and expertise to build tailored dashboards. |
Real-Time Data | Real-time data access and alerting. | Real-time data access and alerting. | Can provide real-time data, but often requires complex configurations and may impact performance. |
MSP-Specific Features | Pre-built customer health dashboards, multi-tenant workspaces, HaloPSA plugin. | Lacks features tailored to MSP workflows. | Not specifically designed for MSPs; requires custom solutions for multi-tenant management. |
Pricing | Transparent and cost-effective; free tier available; scales based on features, not per-user. | Included with M365 subscriptions. | Can be expensive, especially for larger organizations with many users. |
Integration with M365 | Excellent; leverages Microsoft Graph API for seamless integration. | Excellent; leverages Microsoft Graph API for seamless integration. | Strong integration, but requires configuration and may not surface all M365 data natively. |
Alerting & Notifications | Notification APIs available. | Notification APIs available. | Alerting capabilities depend on configuration. |
Scalability | Effortless scaling due to data mesh architecture, no costly data warehouse required. | Limited scalability beyond basic usage; struggles with large data volumes. | Highly scalable, but can require significant infrastructure and resources, especially with large datasets. |
Ease of Deployment | Rapid deployment (under 5 minutes) with minimal configuration required. | Rapid deployment (under 5 minutes) with minimal configuration required. | More complex deployment process; may require dedicated IT resources. |
Ultimately, the ideal choice depends on the requirements, size and type of business. But while Microsoft 365’s Admin Center is functional and Power BI offers great flexibility in analytics, SquaredUp provides a unique combination of ease-of-use, real-time monitoring, and instant sharing capabilities. Its direct API integration eliminates the need for complex configurations, making it particularly appealing for busy administrators managing compliance or security in dynamic environments.
SquaredUp empowers teams to visualize critical metrics in seconds—whether tracking license usage or monitoring compliance violations—while fostering collaboration through its user-friendly interface.
Still unsure? Here’s a quick guide to deciding on the best M365 reporting tool for your workplace:
1. Use Microsoft 365 Admin Center for basic auditing and compliance reports.
2. Leverage Power BI for advanced analytics and visualization.
3. Choose SquaredUp for fast, flexible dashboards tailored to administrators seeking efficiency and simplicity.
Among these tools, SquaredUp emerges as the most practical solution for modern organizations aiming to maximize their M365 investments while minimizing complexity.
SquaredUp’s smarter dashboards help engineering, product, and IT teams make better decisions through a deeper understanding of their data. We have a completely free tier available for you to use today. Sign up for free now!
SquaredUp


Getting started with SquaredUp is free and easy. Our free tier includes: