Richard Benwell
Founder & CEO, SquaredUp
A summary of my presentation at Gartner IOCS on 21st November 2023
Founder & CEO, SquaredUp
The single pane of glass is perhaps the most enduring and elusive goal of enterprise IT operations teams.

When we polled our customers a couple of years ago, out of 184 respondents,99% of them rated it as important to their business – with 64% indicating “extremely important”.
The shared dream is to have:
But unfortunately, the single pane of glass has become a bit of myth.
The reality is that tools that are pitched as a single pane of glass often hit cost concerns and complexity barriers, or fail to keep pace with the changing technology landscape. Either way, they never end up being quite what we expect.
I’d like to share that there’s a better way. But first, let’s take a look at what’s powering the drive for a single pane of glass. What challenges are we facing as an industry in enterprise observability that we want the single pane of glass to solve?
There are four age-old challenges to enterprise observability that have become even trickier to solve today.


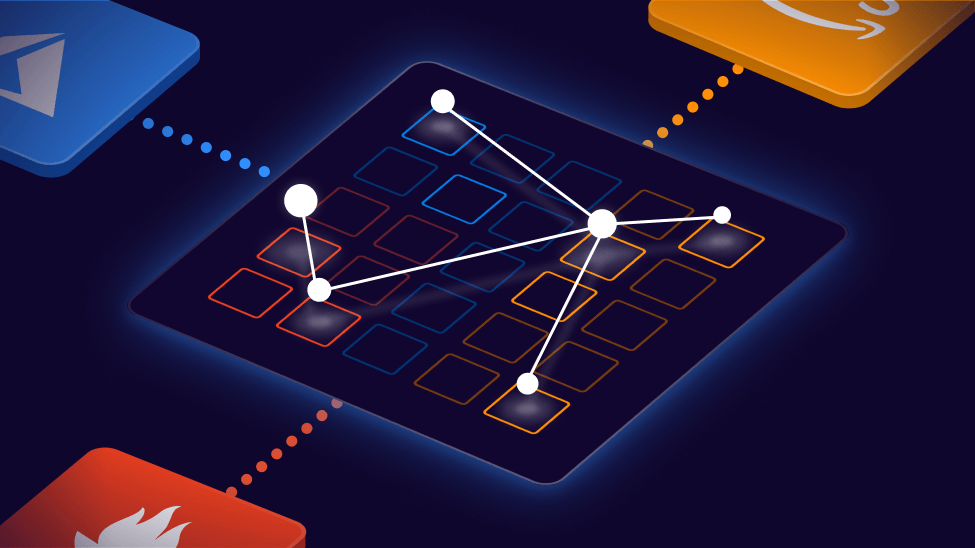
First and foremost, we have always needed to be able to correlate across data sources and collaborate across teams – to better understand status and resolve incidents.
If you're just looking at one single tool, whether it's in your server, cloud, network or state, you're not seeing it in the bigger picture.
This is especially pertinent today with DevOps increasingly coming into play. There's now a whole suite of new tools there that need to be incorporated into your picture.
2. Map dependencies

We also need to map dependencies. Mapping infrastructure and workloads to business services is essential if we want to efficiently escalate incidents or predict service impact.
Without awareness of relationships and dependencies, any alerts or signals you get are just noise. How do you know how to prioritize a particular incident, or a particular alert from any infrastructure? You need the context.
3. Align with business objectives
Critically, we need to align IT with business objectives.

We're very used to monitoring at the application and infrastructure levels. But increasingly, there is a demand to ensure that what we're doing in the technology teams align with business goals.
So that means aligning with business KPIs, customer user experience, our product management team, security, the real cost and increasingly so with the developer productivity as well.
We need a holistic view of our applications and processes to align IT operations with business outcomes.
4. Get the big picture
And finally, perhaps the hardest challenge of all is to get the big picture.

Engineering teams love to focus on the deep. They launch into the complexity and forget about broader business priorities like user experience. We need to be able to summarize the technical details to communicate status to stakeholders, management, and upstream teams.
Business stakeholders need to be able to understand the status and value of a system without needing to delve deep into how that system works.
So, connecting silos, mapping dependencies, aligning with business objectives, and getting the big picture – these four key challenges are tricky to solve. We’ve tried to tackle these problems as an industry in a plethora of ways, but we’ve failed.
Let’s take a look at three key approaches that we have tried so far.
First of all, the single monolithic monitoring tool.
APM tools help engineering teams understand and debug an application’s performance and code transactions, plus how these factors impact user experience. We’ve all been sold the idea of replacing all of our tools with one infrastructure monitoring tool or APM tool.
However, these APM solutions are typically not adopted end-to-end across distributed apps. More often than not, adoption is disjointed across teams, as many teams prefer to keep their existing best of breed monitoring solutions for their particular area.
As a result, what organizations often end up with is n + 1 tools, and at significant cost. They come away still lacking unified visibility.
2. “AIOps” and ITOM
Another approach that the industry has tried is centralizing the alerts from all of our other tools. The promise of AIOps and ITOM is to be able to tell you what the problem is after ingesting all of the alerts across your tools and running some magic on them.
While AIOps is a helpful troubleshooting starting point, it falls down as a single pane of glass – especially when it comes to visibility of status or KPIs. This is because the solution looks at alerts with no additional context. Aggregating a sea of alerts without any of the necessary context leads to an incomplete picture at best. At worst, it clouds your visibility with yet more noise.
3. Data lake / warehouse observability platforms
More recently, the idea of an observability data warehouse has grown in popularity. Data across all your tools is ingested into a single place, and then queried and analyzed.
This sounds great in theory, but copying and storing data from across the engineering stack not only takes a colossal effort, it also incurs great expense, and is forever one step behind the changes happening in real time.
This is a sure-fire way to burn through your observability budget in the first month.
As we trend towards data lakes and data warehouses, it’s becoming clear that part of the observability question is a data problem.
There is so much data, from a huge range of data sources. This is a problem that the BI industry has been trying to solve for years.
Perhaps there are some lessons to learn.
Generally in the world of BI, the trend has been to stop collecting and start connecting data.
The journey the BI world has been on is not dissimilar to that of the observability world – but they seem to be a step ahead.
Let’s take a look at where they are now and how they got there.
Stage 1: Data warehouse

Historically, BI used data warehouses – taking data from online databases, centralizing it, then organizing it so that it can be transformed and queried. This was complex and inflexible.
Stage 2: Data lake

So they moved on to the idea of a data lake. Here, resource isn’t spent on organizing the data ahead of using it. However, the problem is that it gets very costly ingesting all of that data, and then it is difficult for the analytics team to make sense of it all. The people who would best make sense of this data are the subject matter experts, but the data has been moved away from them into the hands of the analytics team, who don’t truly understand it. This problem is what gave rise to the term “data swamp”.
Stage 3: Data mesh

So then the BI world moved a step further along, and started looking at something called data mesh, where we don’t centralize the data – we leave it where it is. Instead, we centralize the organization of that data.
We understand what data we have because it is correlated with other data. We make it consumable by our engineering teams and business stakeholders. It's scalable, adaptable, cost effective.
Now when we start thinking about how it applies in the world of observability, those properties are exactly what we need.
To address these needs, we built SquaredUp Cloud – a new unified observability portal that delivers on the data mesh concept in three layers.

First, we have the data virtualization layer – the layer that lets us plug into over 60 data sources and stream data on demand. The data stays right where it lives, but we normalize all that data and make it consumable on demand.
In other words, we created on-demand, normalized, data access to over 60 tools – with plenty more data sources to come.
2. Relationship mapping (the context layer)

The next layer is the heart of the data machine – the context layer. SquaredUp Cloud allows you to correlate data across all your data sources, mapping the relationships and dependencies of your tools and services.
You can also easily roll up status, summarize KPIs or do service modelling – all in snapshot views that are shareable with your stakeholders.
3. Data visualization (presentation layer)

And finally, just like the BI tools Tableau and Power BI, we offer a data visualization layer on top. It’s simple and intuitive. This means self-service dashboards for everyone – individual dev teams, DevOps teams, operations teams, and even management.
Universal search means finding your data is easy. SQL analytics makes for flexible, customizable dashboarding. Sharing is possible in a few clicks, with customizable access control. And, our advanced monitoring and notifications features mean that you never miss a beat.
Watch this video for a brief introduction to our product.
Alternatively, book a demo to get a short tour. Our Solutions Engineers will be happy to explain how SquaredUp can work best for your use case!
Founder & CEO, SquaredUp

Here's what our free tier includes: