John Hayes
Observability Advocate, SquaredUp
Most of the time the build and deployment pipelines we create will run on compute provided by the Azure DevOps cloud and the only decision we need to make is whether to select a Windows or Linux Agent.
Sometimes though, the specification for the VM that Azure DevOps spins up may not be right for our needs. We may need more memory or a particular OS version. This is when custom agents and Agent Pools come into play.
Our Azure DevOps plugin already provides a wealth of rich metrics spanning pipelines, builds repos, and more. In our latest release, we have added visibility for custom agents and Agent Pools, giving you rich insights into the health and performance of your agents without the hassle of digging around in the Azure DevOps UI.
When you load up the plugin, you will now see data streams for viewing all aspects of your Agents and Agent Pools, including Agent Runs, Agent Usage, and Diagnostic Logs.

You can then easily zoom in and narrow down the scope of your dashboard to individual objects or you can use our data shaping tool to easily filter by a wide range of attributes, including Status, Agent Type, Pipeline, and many more.
If you have many pipelines and are deploying frequently, you can easily exhaust the default concurrency limits. Equally, if you are self-hosting you may also hit bottlenecks, you can now get full visibility of performance with our Agent Pool Consumptions data streams:

We naturally also want to have a strong visual indicator of the health of our agents. In SquaredUp this requires zero configuration. Just select the Agents data stream and SquaredUp will default to a blocks visualization which will intelligently map to the status of the agent.

In this example, we have enabled monitoring on these blocks. This means that notifications on the health of our agents will automatically roll up to the parent workspace for our dashboard, enabling engineers and managers to see all of their key signals in one unified space.
As you scale up your pipeline operations you may have a large number of pools and agents. The pools data stream gives you a great overview of the distribution of agents across your pools.

If you need to do more granular diagnostics we also have a data stream for agent pool logs. Once again SquaredUp has built-in intelligence that understands the log structures and automatically maps the status of each entry so that you have a visual cue for warnings and errors.

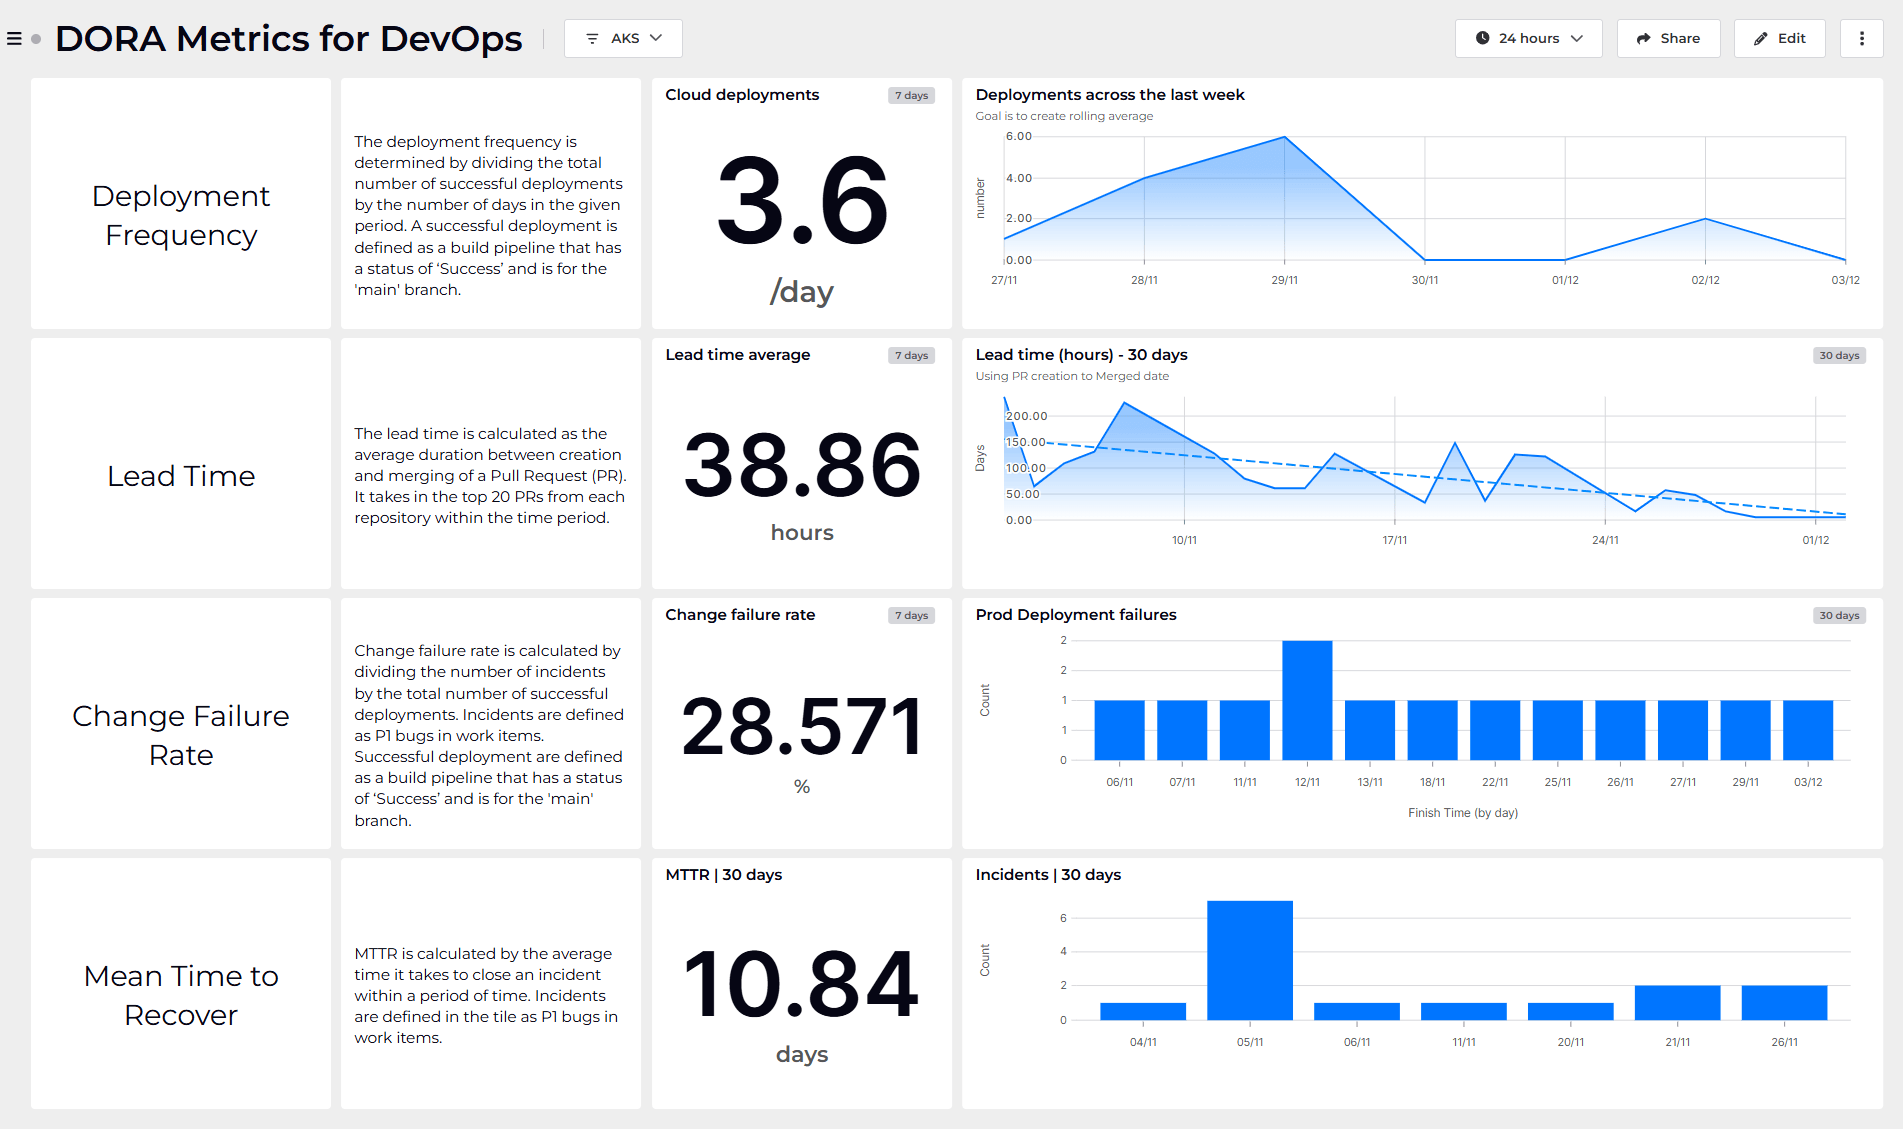
There is a lot more to explore in our Azure DevOps plugin, which gives unrivalled coverage of your Azure DevOps activity as well as unique analytics such as our out-of-the-box DORA dashboards.
If you don't have a SquaredUp account, you can sign up for our Free Forever plan and start getting visibility of your Azure DevOps projects in minutes.
Observability Advocate, SquaredUp


Getting started with SquaredUp is free and easy. Our free tier includes: