Bruce Cullen
Director of Products, SquaredUp

Director of Products, SquaredUp
In previous roles I have been both an Engineering Manager responsible for a team, and a Program Manager responsible for branching strategy and process around CICD pipelines. In both of those roles (but for very different reasons), my product's build quality has been critical to product success. The obvious "why" to this is no builds, no product, but the real why is much more nuanced.
Deployment frequency, which is very closely linked to build frequency for obvious reasons, is one of the four DORA metrics measuring throughput. Any issues causing build times to grow or automated tests to fail will directly impact this metric. Automated test quality (flakey tests) and pass rate are directly related to another DORA metric measuring stability - Change fail percentage.
Whether you use Azure DevOps Cloud or On Prem, our out-of-box dashboards have everything you need to keep on top of key pipelines without having to spend any brainpower on what to keep track of. There are two key dashboards I will focus on in this blog, the first is our Pipelines Overview, letting you see at a glance what is going well and where you need to spent a little more time on one or more CICD pipelines from Azure DevOps and our Pipelines Trends dashboard that shows you what is happening over a longer timeframe that may be a cause for concern.

This dashboard shows you…
The build failures tile is set to display failures over a rolling 24hr window and ships with a monitor configured so if build failures are good today, but spike above a threshold of x (which is configurable) you can be notified via Slack/Teams/email/ServiceNow/ in any tool you like via webhooks
If you have a spate of cancelled builds, perhaps because of some automation you have setup years ago, tracking failed builds along wont help you. The Build results by status tile easily lets you see the full picture, counting all build runs by their state.
Build runs are made up of stages and tasks, a sudden uptick in task failures may not cause build failures to follow suit but can be indicative of other issues such as automated unit test failures, a code security scanner not being able to complete its scan, potentially leaving your code vulnerable or automated test framework issues. This tile will break down task failures by task.
Sometimes your simply looking for the latest build’s number from a specific branch and don’t want to have to fire up the Azure DevOps console to be able to see it. This tile lets you see this and the build status at easy glance
The number of builds in progress gives you a good idea of how your pipeline is being user right now, and may help you spot peaks that will result in queue time spikes or agent issues preventing builds from running
If some code committed to a dev branch significantly spikes the build duration, or that new raft of automated tests looks to be stuck in a loop in a beta branch, you can easily see it before the offending code is pushed to master branches with this tile
Build frequency is one of the key DORA metrics – as this tile by default follows the timeframe set at the dashboard level (or can be configured to its own timeframe) it allows you to see exactly this.
“The pipeline takes too long to build” is a classic engineering team complaint, and is part of DORA metrics once again, so anything that can be done to speed it up is worth knowing about. A common culprit for slowing build times are those automated test cases. While valuable in validating the quality of the pipeline’s code, they take time to run and an extremely long running task might be ripe for optimization to speed up the pipeline.
A failing test typically indicates quality issues with the code, but tests that fail excessively are more likely to be caused by issues with the test scripts themselves so understanding if you have such tests can be critical to reducing false positives and increasing overall code quality
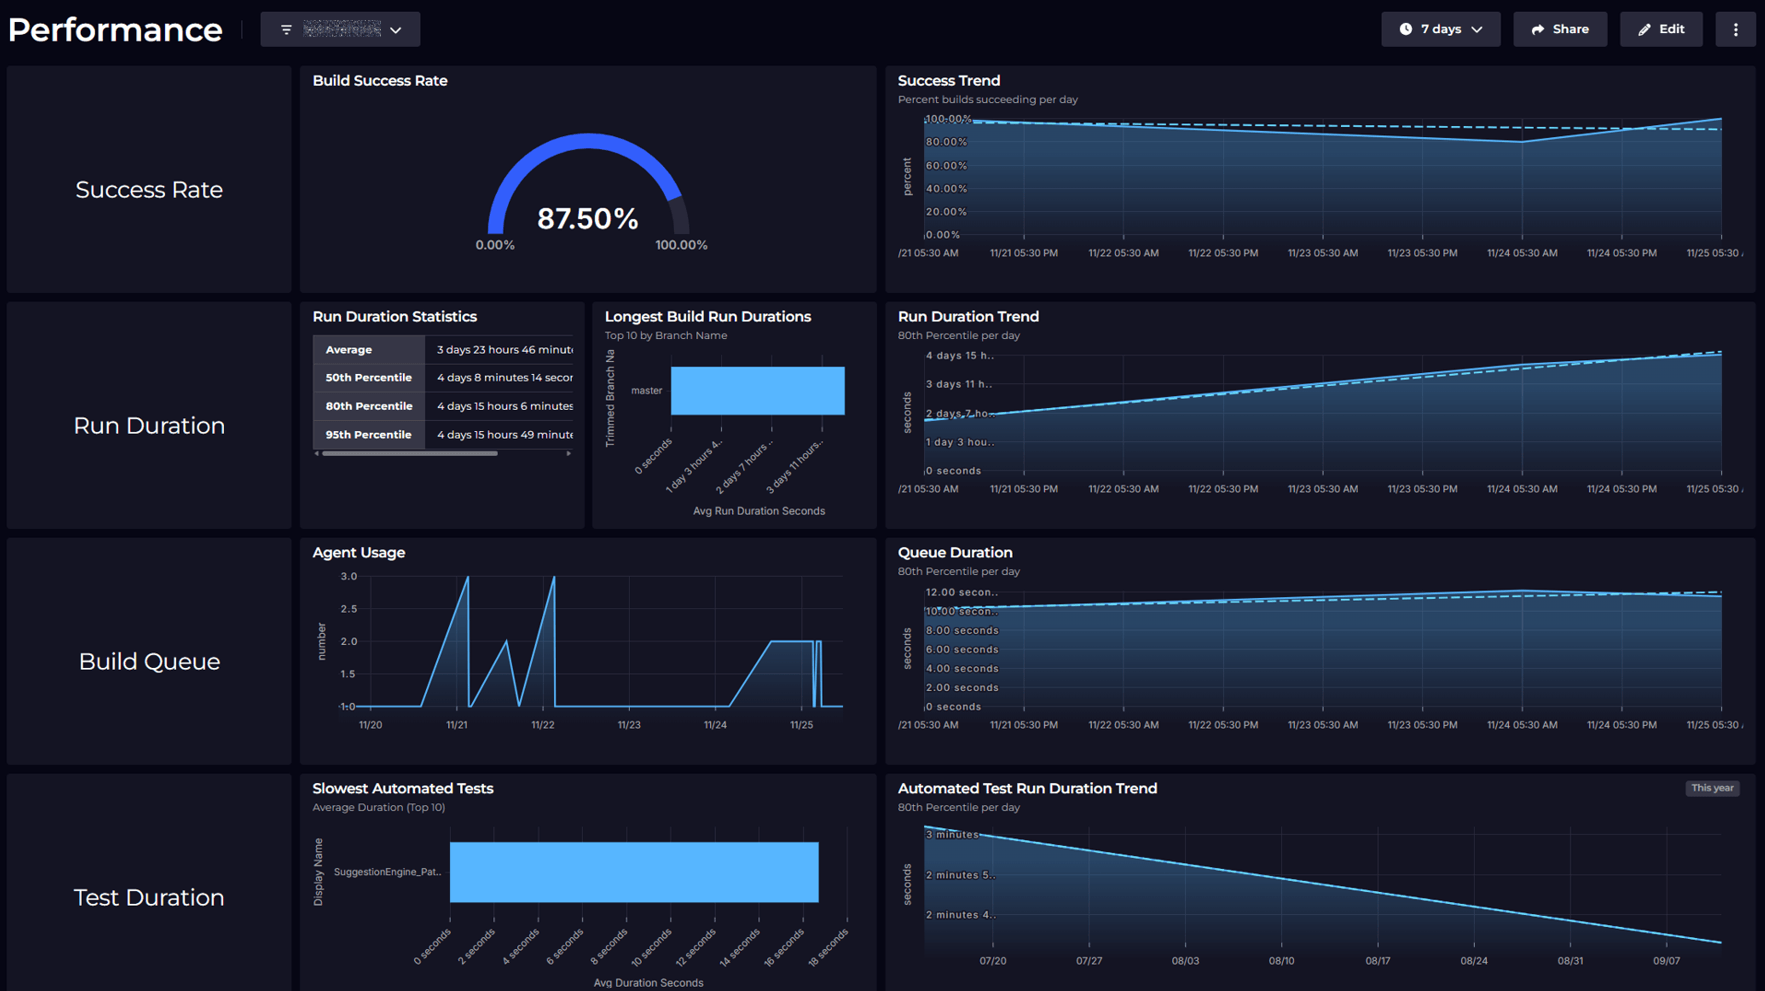
Unlike with the Pipeline Overview dashboard, designed to give short term insights you need to take action on quickly, the Pipeline Trends dashboard is all about those things that slowly change over time and while they typically aren’t fires today, they could well become fires in the future.

The timeframe of this dashboard is best set at 7 days or more to enable you to really spot those trends (rather than picking up outliers and anomalies). Most of the tiles on this dashboard are driven by the analytics APIs. This dashboard contains:
We all want our builds to succeed all the time, but in reality this is rarely the case. If we have SLOs to meet, keeping on top of build success rate can be important as deviations from an agreed SLO will likely mean delays in getting out valuable code and quality issues. The tile ships with a monitor so notifications are send where success rate dips too low. A warning threshold of 80% and critical threshold of 90% over a 7 day timeframe are set by default, but these are fully configurable,
Is there an issue causing run duration to slowly drop over time such as increased process load or context switching taking its toll on the team? This is another one of those DORA metrics so is important to keep an eye on
Tests fail every now and again, they are designed to do so when quality issues are picked up, but a dip in pass rate over a sustained period of time can be indicative of something more important than a bad commit, such as highlight a skills gap in a new team or a change in team structure taking its toll on the quality of their code.
Agents are the backbone of any pipelines system, and while there are a finite number of them, if they are always busy a queue of build jobs will build up which will have a knock on impact on build frequency. An extra agent in an existing pool is a relatively quick fix vs a team issue.
If fewer builds are coming out of your pipeline over time it is important to dig into why. It might simply be down to a team committing less over the holiday season but might indicate other harder to fix issues such as requirement size creeping up or developers committing code less frequently, which in turn increases the complexity of fixing test failures in the pipeline or later down stream due to the size of the code committed that now needs to be unpicked.
Ideally a stable queue duration should be maintained, if you have to have a queue in the first place. In some cases a queue is unavoidable so keeping on top of its size becomes important as if you don’t do so and a queue builds up build duration and time between commit and deploy creeps up
The more tests that succeed, the higher quality the code flowing through your pipeline generally will be (though it can quickly become more nuanced than this!)
In summary, its important for anyone responsible for pipelines to have a good handle on the fires that are burning today, and the fires that might start burning tomorrow which starts with clear visibility into what is happening with your pipelines and is all provided out of the box with out Azure DevOps data source.
Director of Products, SquaredUp


Getting started with SquaredUp is free and easy. Our free tier includes: