Nathan Foreman
Principal Software Engineer
Principal Software Engineer
I recently delved into the idea of using labels within Prometheus to craft objects and hierarchies where none initially existed. Check out that piece here. The essence was harnessing the prowess of OTEL to achieve more, faster.
The ambition? Transform these abstract virtual objects and integrate them into SquaredUp's knowledge graph, thereby unlocking the potential of data mesh and correlation.
Fast forward through weeks of development, iterations, and tweaks, I'm now thrilled to unveil the first full version for SquaredUp!


The tag data exists in Prometheus, but it's far from streamlined to see what the ‘CurrencyService’ really is until its consolidated.
I'll save the deep dive into data mesh for another post, but here's the gist: In a world where every system boasts its data and unique API, it's far more efficient to query data where it resides rather than continuously shuffle and reprocess it. Taking it up a notch, correlating this data means amalgamating multiple sources into a unified dataset in real-time.
Raw, unidentified data is like a ship lost at sea. The more context we can wrap around data, the better we grasp and harness its potential. As our data reservoir expands, the importance of grouping and correlating these data fragments escalates.
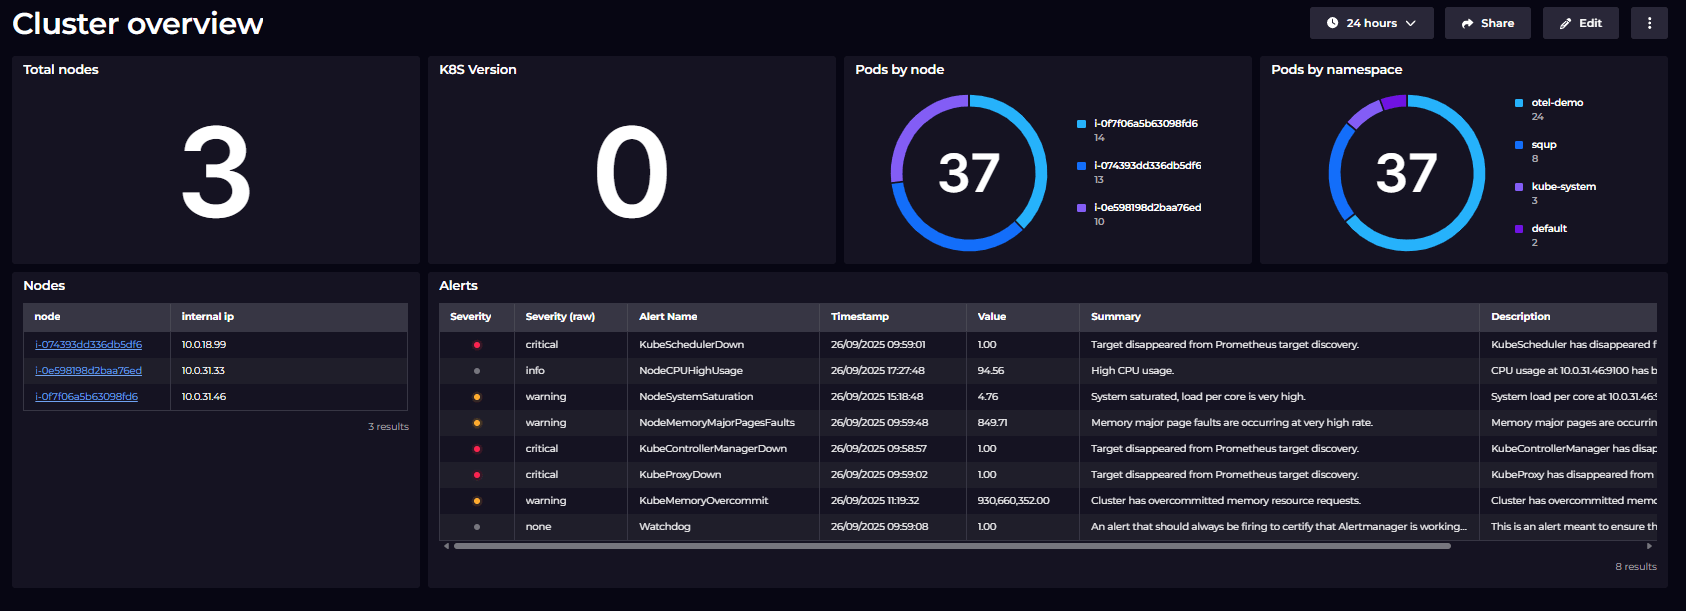
The concept of using tags to spawn virtual objects is straightforward yet transformative. We've evolved from a singular time series to something more tangible and relatable. A prime example is the Kubernetes Pod showcased below, where all relevant Time Series Metrics are easily identified, and common properties are synthesized to paint a comprehensive picture of the Kubernetes Node.

Data from both AWS and Prometheus are now joined, taking a mess of tags to a clean list of properties describing our ‘CurrencyService’
By directly extracting pivotal properties from source APIs, Data Mesh technology scales at an unprecedented rate. No need to index vast data volumes; just spin up a few more instances of our serverless functions to connect to an array of Prometheus nodes and other data sources. Once indexed in the knowledge graph, the doors to Discoverability and Interoperability swing wide open, all thanks to this standardized data.

The data from AWS and Prometheus are meshed behind the scenes to create this view which neither tool could produce independently.
Your appetite for tangible applications is palpable, and I'm here to satiate it.
Let's delve into a use case that masterfully bridges data between an AWS-hosted EKS cluster and the Prometheus Metrics it churns out.
When you peek into the AWS Console, the EC2 Instances running the Kubernetes nodes present a certain narrative. They offer insights into the operational health, uptime, and resource utilization of these instances. This is the platform's perspective, a bird's-eye view of the infrastructure that supports your applications.
On the flip side, Prometheus dives deep, capturing metrics right from the code running within the Pods. This is the application's heartbeat, revealing performance metrics, error rates, and other vital signs that developers and operations teams care about.
Marrying these two perspectives, with both plugins harmoniously in sync, paints a holistic picture. You're no longer limited to just the infrastructure's health or just the application's performance. Instead, you get a dual-lens view that's both broad and deep.
Similarly, when we talk about networking components (load balancers for example), the AWS Console provides metrics like request counts, latency, and backend connection errors, giving you a sense of how effectively traffic is being distributed. Meanwhile, Prometheus offers insights into the application's response times, error rates, and throughput as it passes through these load balancers. Together, they ensure you're not just distributing traffic, but also delivering a stellar user experience.
Moreover, by consolidating metrics and information related to these logical resources, troubleshooting becomes a breeze. The example of the AdService Service below is a testament to this, offering a panoramic view of all resources, both from the infrastructure and application perspectives.

Open Telemetry's popularity is surging, and so is our momentum at SquaredUp. This release is merely our starting line. From a developmental standpoint, more use cases and scenarios are invaluable. If you're navigating the waters of Prometheus, OTEL, and AWS, we're eager to collaborate and refine our features to resonate with your needs.
If you're eyeing other data sources to integrate, explore our data sources page and experience the SquaredUp difference today.
Principal Software Engineer

Getting started with SquaredUp is free and easy. Our free tier includes: