Sameer Mhaisekar
DevRel Engineer, SquaredUp & Microsoft MVP

Azure DevOps and its extensive feature set helps teams plan smarter, collaborate better, and ship faster. With several integrated features such as Azure Pipelines or Azure Repos, it gives you the flexibility to use just what you need to complement your existing workflows.
However, as your usage of Azure DevOps grows, you might find that monitoring and observing key CI/CD metrics across these services gets increasingly challenging.
If that sounds like you, perhaps what you're missing is a DevOps dashboard – one that aggregates and connects data from your pipelines and releases, across all of your projects and teams. Let's see how you can create one with SquaredUp and its ADO plugin.
The Azure DevOps plugin supports two authentication methods, Microsoft Entra ID and Personal Access Token (PAT).
Microsoft Entra ID allows the data source instance to access Azure DevOps using a user account – good for quick testing, but not ideal from a security point of view. To be more granular with permissions required, we use the PAT method. You can see how to request a PAT in the in-app docs.
Under Product, select Azure DevOps Cloud, and enter the name of your cloud.

And that's it! Given that everything has been inputted correctly, SquaredUp will start importing objects from your DevOps environment.
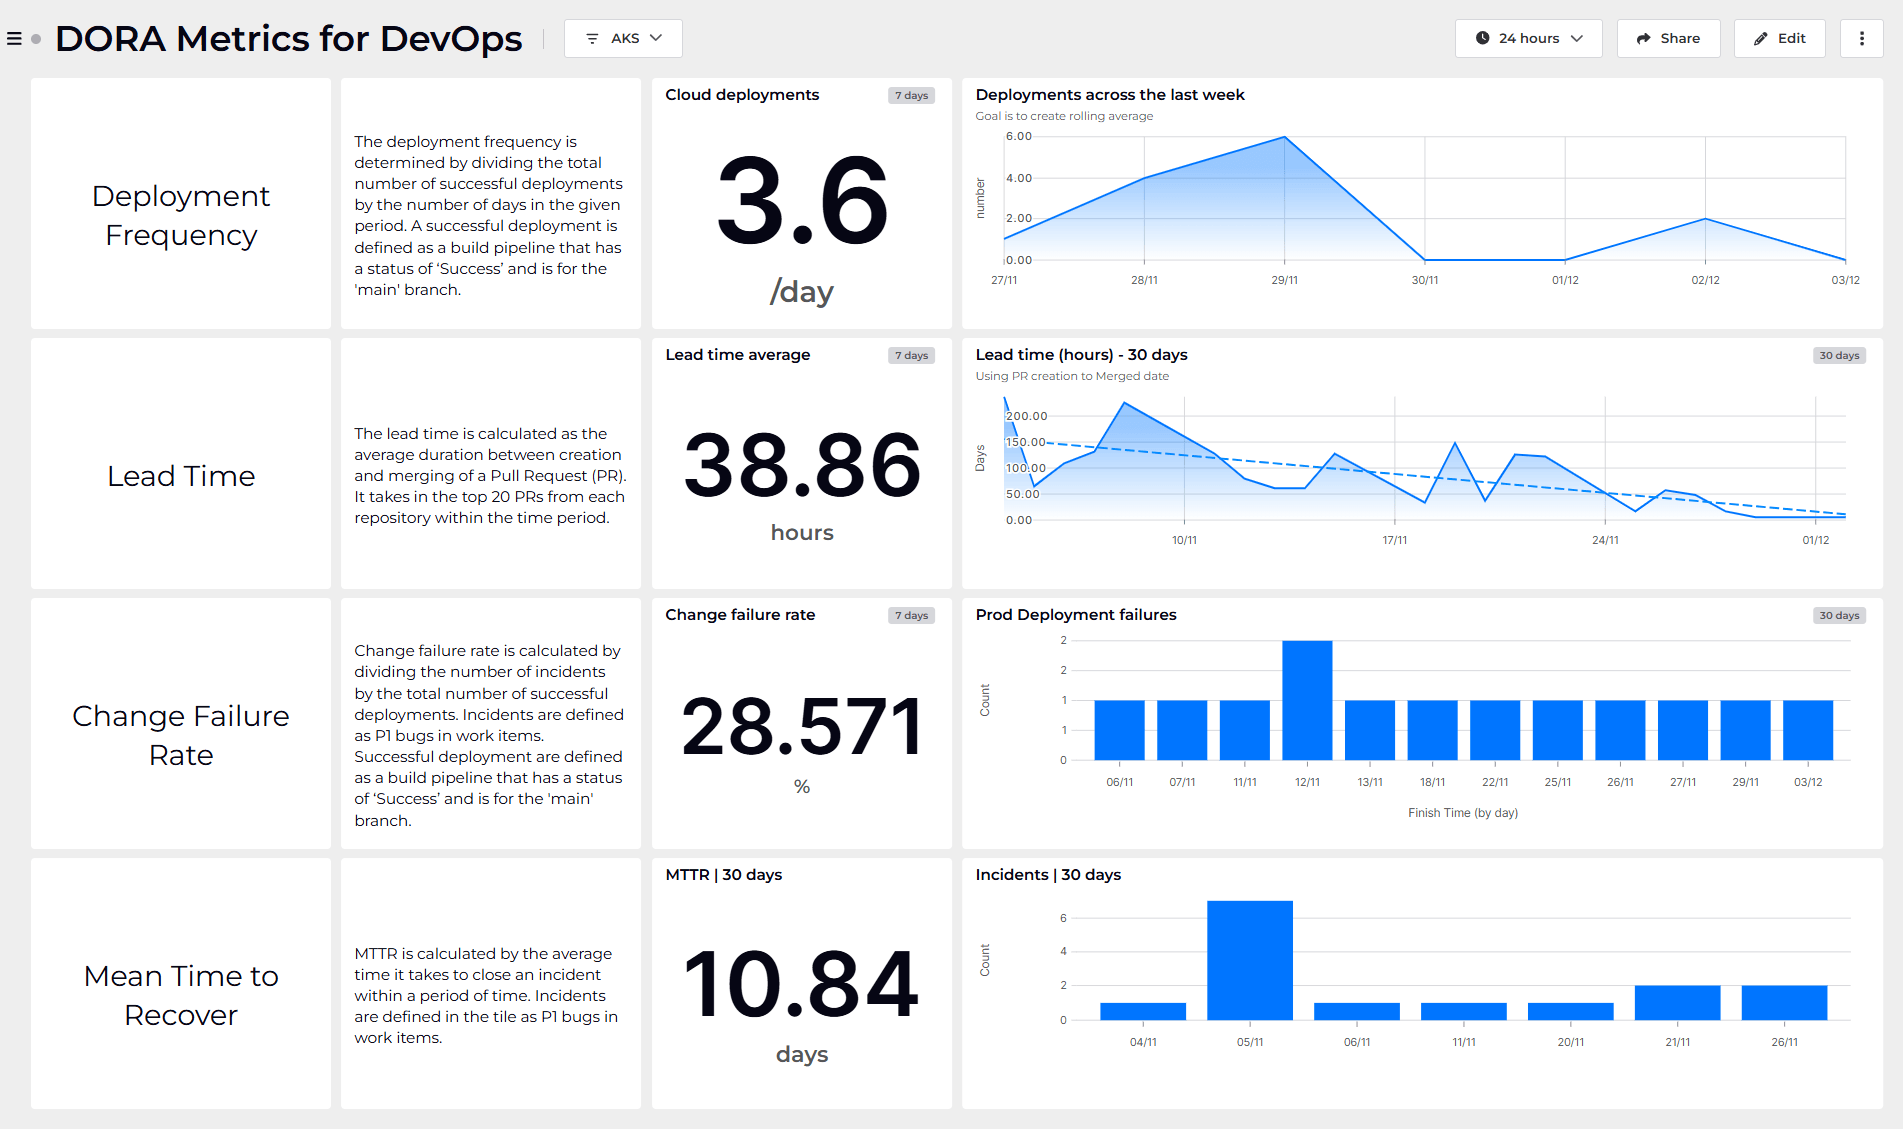
The ADO plugin comes with a few of out-of-the-box dashboards, pertaining to Pipelines, Boards, Repos etc. There's also a dashboard tracking DORA metrics that helps you hit the ground running.
Let's take a look at the DORA dashboard:

It plots the following metrics:
You can read more about what DORA metrics are and how this dashboard was made to get more insights.
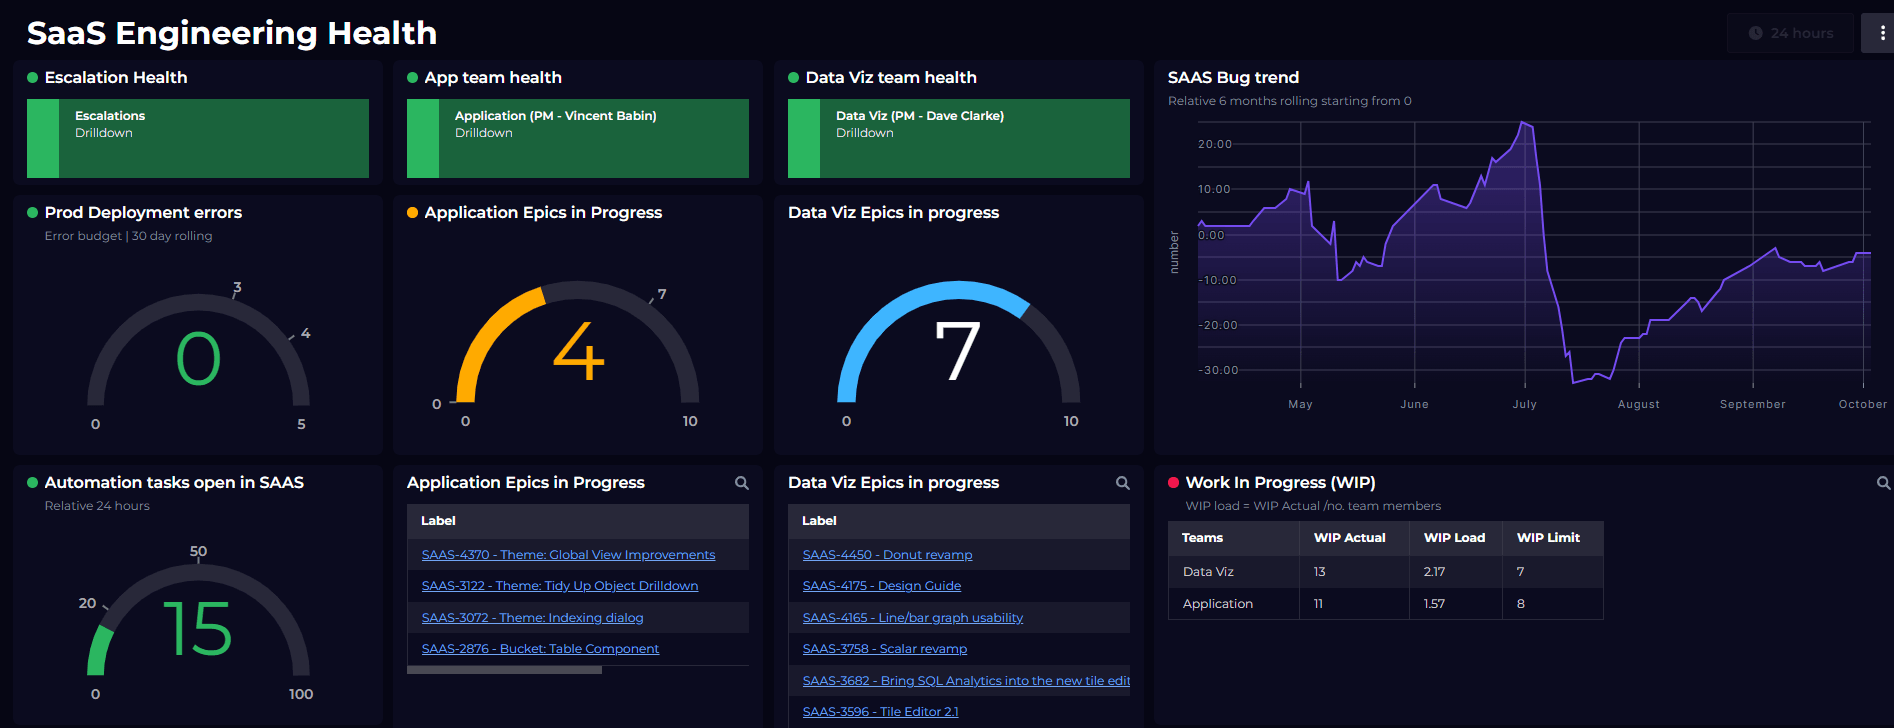
I encourage you check out other OOB dashboards as well. Once we're ready, we can explore the plugin ourselves.
Hit the + button on a new dashboard to create a tile. The ADO plugin comes with a number of data streams with various metrics and also a WIQL data stream to let you query the work items.
For the demonstration I'll use the "Build Runs" data stream to fetch all the builds in a project.

On the Parameters screen, I can provide additional configuration and filters to narrow down the result I want to see. I will keep it default for now.

Next, choose the timeframe over which you want to see the builds. You can use the one set at the dashboard level or choose the one that works better. Here, I'll choose 7 days.

Over the next Shaping and Columns screens you can perform additional filtering and data type configurations of the results returned. You can also use SQL Analytics if you need to perform advanced data manipulation and calculations.
All that done, we have got our data we requested – a list of build runs for the project squaredup in the last 7 days.

From this point on you can pick the data and choose which visualization to best plot it against.
For example, in one of the columns returned named State (raw), I see some builds were canceled. So I'll filter the results to only scope to the ones that were canceled and change the viz type to "Blocks".
And with that my tile is ready:

You can now go ahead and explore other data streams and visualizations to see what other data you can get with the plugin and create your own dashboards.
SquaredUp monitoring makes it easy to turn our dashboard tiles into monitors, so that we can be alerted about changes.
In the dashboard I made above, I'd like to monitor when a canceled build is detected and send me a notification about it.
So I'll toggle the Monitoring option on, switch over to "State" type and set up monitoring on the State column. As you can see in the preview, as it has detected some canceled builds, it's state has turned to Warning.

Next, to set up the notifications, you have several endpoints you can send it to. Yo can send emails, or notifications on IM platforms like Teams, Slack or even to a custom webhook.

Sharing is very simple in SquaredUp. We just hit the share button and have the option of inviting a user to the workspace, or sharing just the dashboard via a link:

From this point on, you can use the Azure DevOps plugin to try out different data streams and queries to create dashboard of your dreams. In addition, we also have many other plugins including Azure, Azure Costs, PowerShell and many others.
Sign up for free and experience the power of SquaredUp yourself!
DevRel Engineer, SquaredUp & Microsoft MVP


Getting started with SquaredUp is free and easy. Our free tier includes: