Sameer Mhaisekar
DevRel Engineer, SquaredUp & Microsoft MVP
SquaredUp is a flexible dashboard and analytics platform that makes it really easy to dashboard your M365 and Intune usage and analytics. You can then use it for monitoring or sharing!
In this article we’ll take a look at getting started with the M365 plugin for SquaredUp and building our first dashboard. Sign up for a free account if you’d like to follow along.
The first step in creating dashboards with SquaredUp is to add a data source – in this case it's M365. In the workspace, add a new data source. In the search box, just look for 365, and the plugin should appear.

While configuring, you'll notice that there are a couple of authentication methods. You can use your Microsoft Entra ID directory to authenticate the user or use the client ID and secret via an app registration.
You will also notice a checkbox for Intune support, a cloud-based endpoint management solution developed by Microsoft. It helps organizations manage user access to resources and simplifies the management of apps and devices across various platforms, including mobile devices, desktop computers, and virtual endpoints. If you use Intune and want to dashboard its metrics, check this box. In my case, I will check it.

Currently, the M365 data source comes with a single out-of-the-box dashboard for Intune (if you've checked the box), which provides the compliance overview of all your devices currently being managed.

However, more work is being done in this area and more OOB dashboards will be added soon.
This isn't all you can do with the plugin though, so let's go ahead and explore what other data streams are available to us.
Create a new dashboard, and a new tile. To scope our options only to the M365 data source, apply filter on the right.

As you scroll past the list you'll notice that there are a bunch of data streams with the product name attached to them. For example, if you search "Teams", all the relevant data streams will come up. Search for "Outlook" and the same happens, and so on.

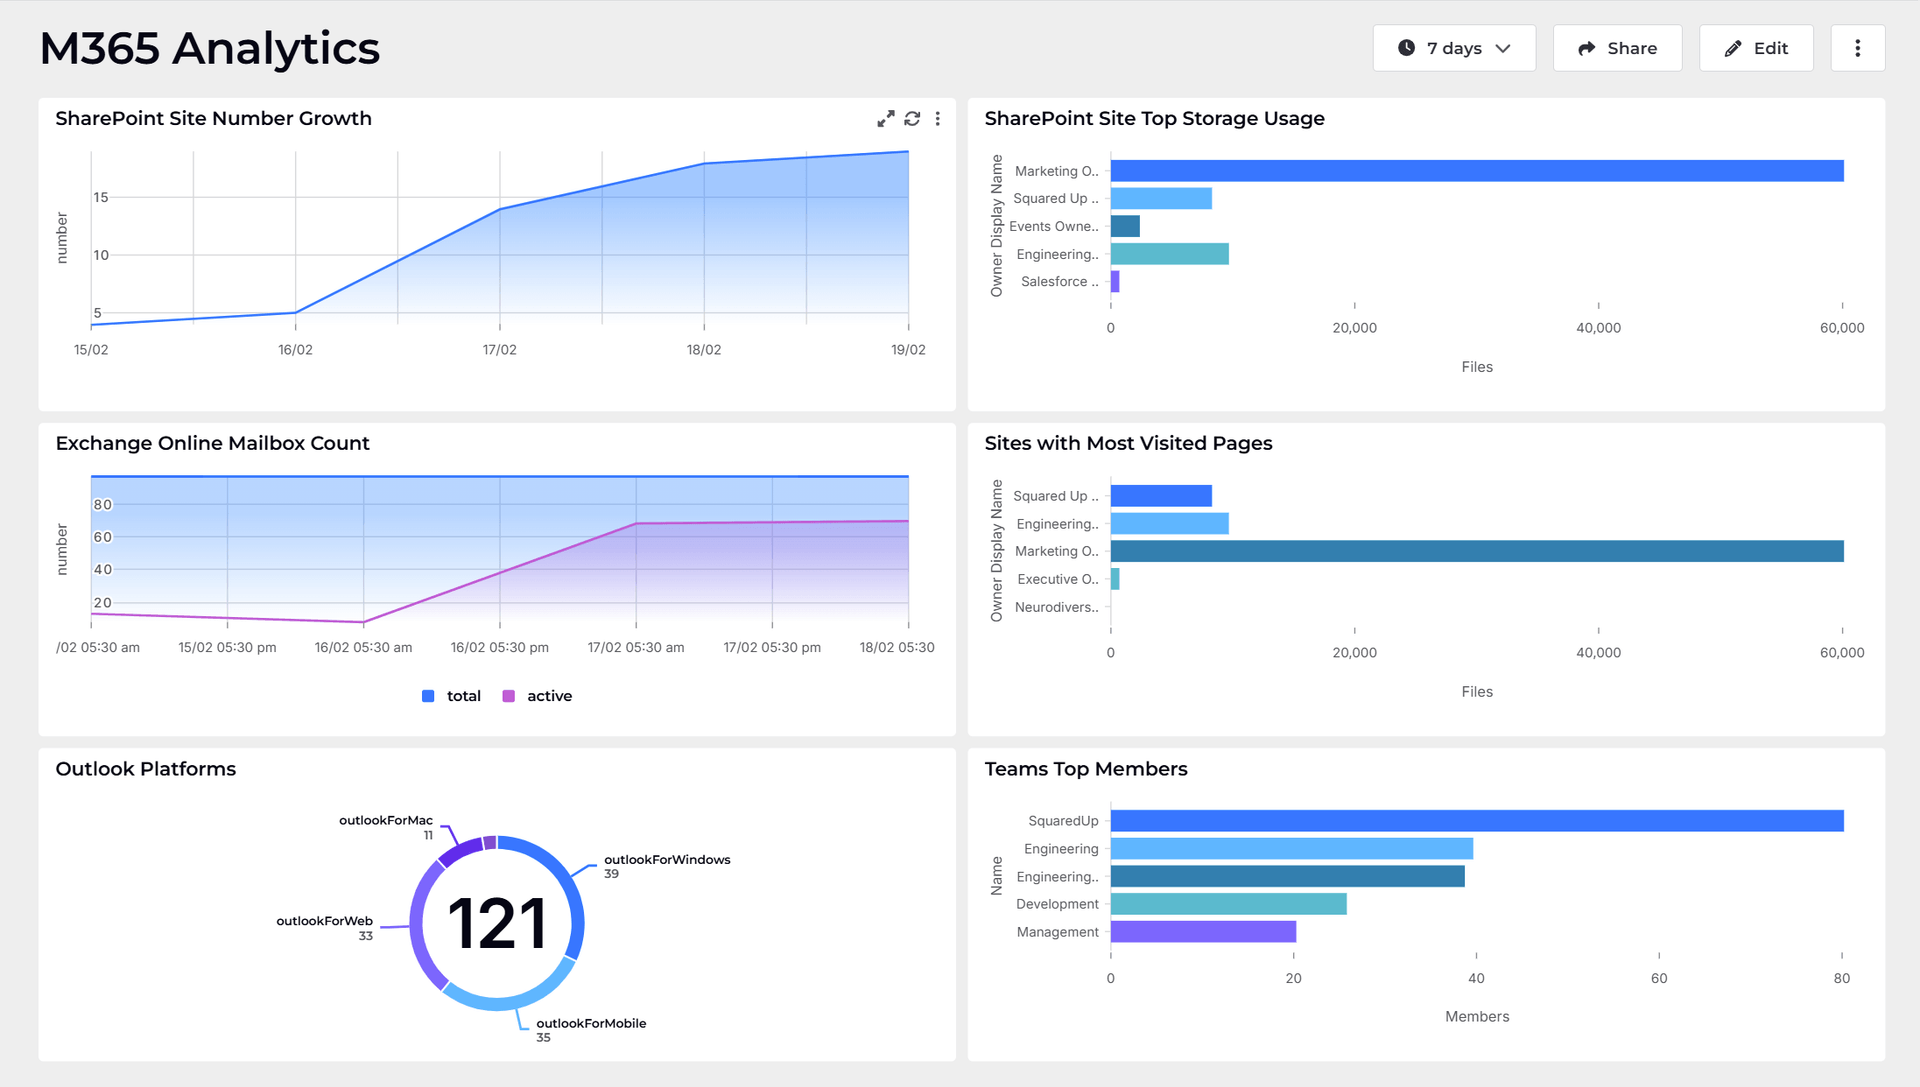
This naming convention, along with the descriptions, is a great way to quickly find the data you need. Let's try to plot the Outlook mailbox usage for the past week. I select the "Outlook Mailbox Usage: Details" data stream and this is the data that is returned.

You can perform further processing on this data to filter it down to exactly what you need. Similarly, you can try out other data streams too, which also includes product usage tracking to ensure license allocation is optimized. A dashboard for that would look something like this:

For Intune, we have more data streams as well. For example, using the "Intune: Configuration Policy Overview" I can display the compliance state of a policy, such as BitLocker in this case:

There is a lot more you can do with SquaredUp dashboards. Let’s finish off with two of the most common use cases: monitoring and sharing.
SquaredUp monitoring makes it easy to turn our dashboard tiles into monitors, so that we can be alerted about changes. For example, I want to set up an alert if the policy BitLocker is not fully enforced.
In the tile above, I'll switch over to Monitoring tab on the right and set up my alert condition.

In this case I'll get an alert if the state of the compliance policy is Error.
If the monitor triggers, we can receive a notification by email, Slack, Teams or via any system that supports webhooks. You can learn more about monitoring here.
Lastly, let’s share this dashboard with others.
Sharing is very simple in SquaredUp. We just hit the share button and have the options of inviting a user to the workspace, or sharing just the dashboard via a link:

Hopefully you have a flavor of how easy is to start dashboarding your M365 usage analytics with SquaredUp. In addition, you might also be interested in adding Azure, Azure DevOps, PowerShell or SQL. SquaredUp has over 60 data sources that you can connect to and fetch the data from. You can get started with a free account, or check out our flexible pricing for dashboarding at scale.
Happy dashboarding!
DevRel Engineer, SquaredUp & Microsoft MVP


Getting started with SquaredUp is free and easy. Our free tier includes: