Sameer Mhaisekar
DevRel Engineer, SquaredUp & Microsoft MVP

SquaredUp is a flexible dashboard and analytics platform that makes it really easy to turn your PowerShell scripts into dashboards that you can use for monitoring or sharing.
In this article we’ll take a look at getting started with the PowerShell plugin for SquaredUp and build our first dashboard. Sign up for a free account if you’d like to follow along.
As an example, we will use some PowerShell scripts to create a dashboard for Azure DevOps by querying their APIs. SquaredUp does have a dedicated Azure DevOps dashboard plugin for easier and more detailed dashboarding of ADO, so feel free to check it out. For now I’ll just use simple queries to retrieve basic data for the sake of our demo here.
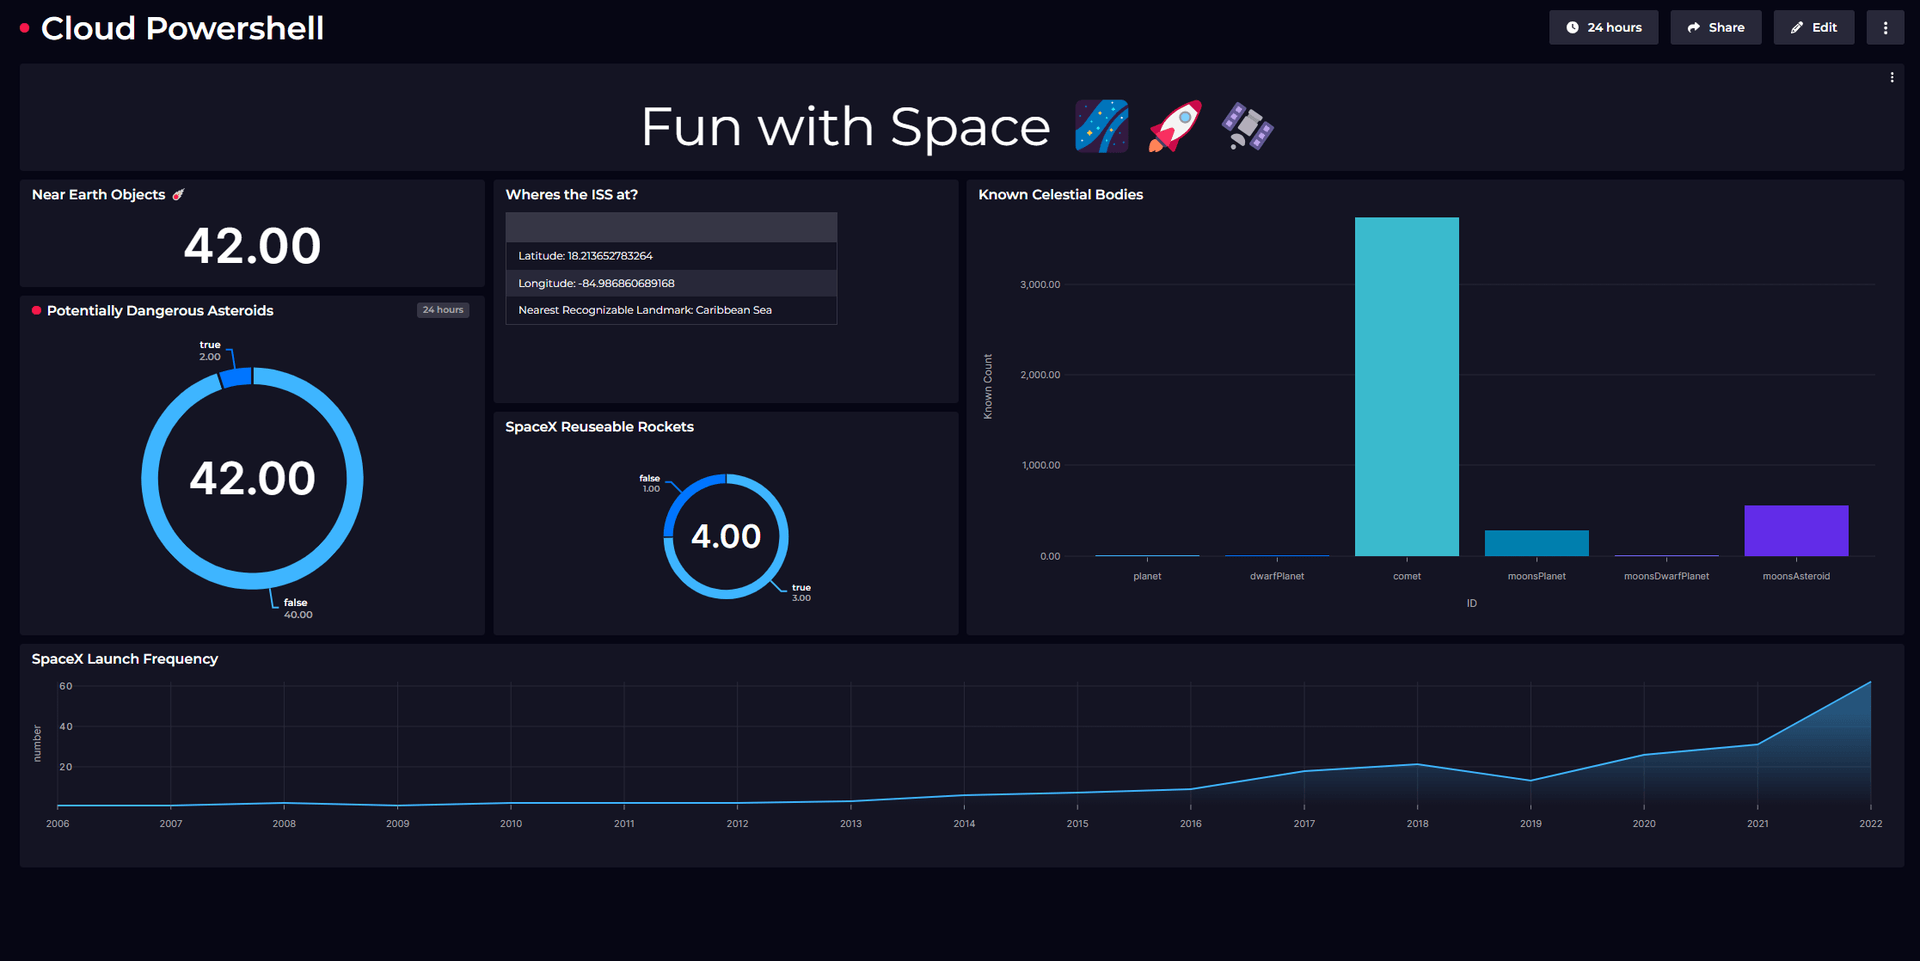
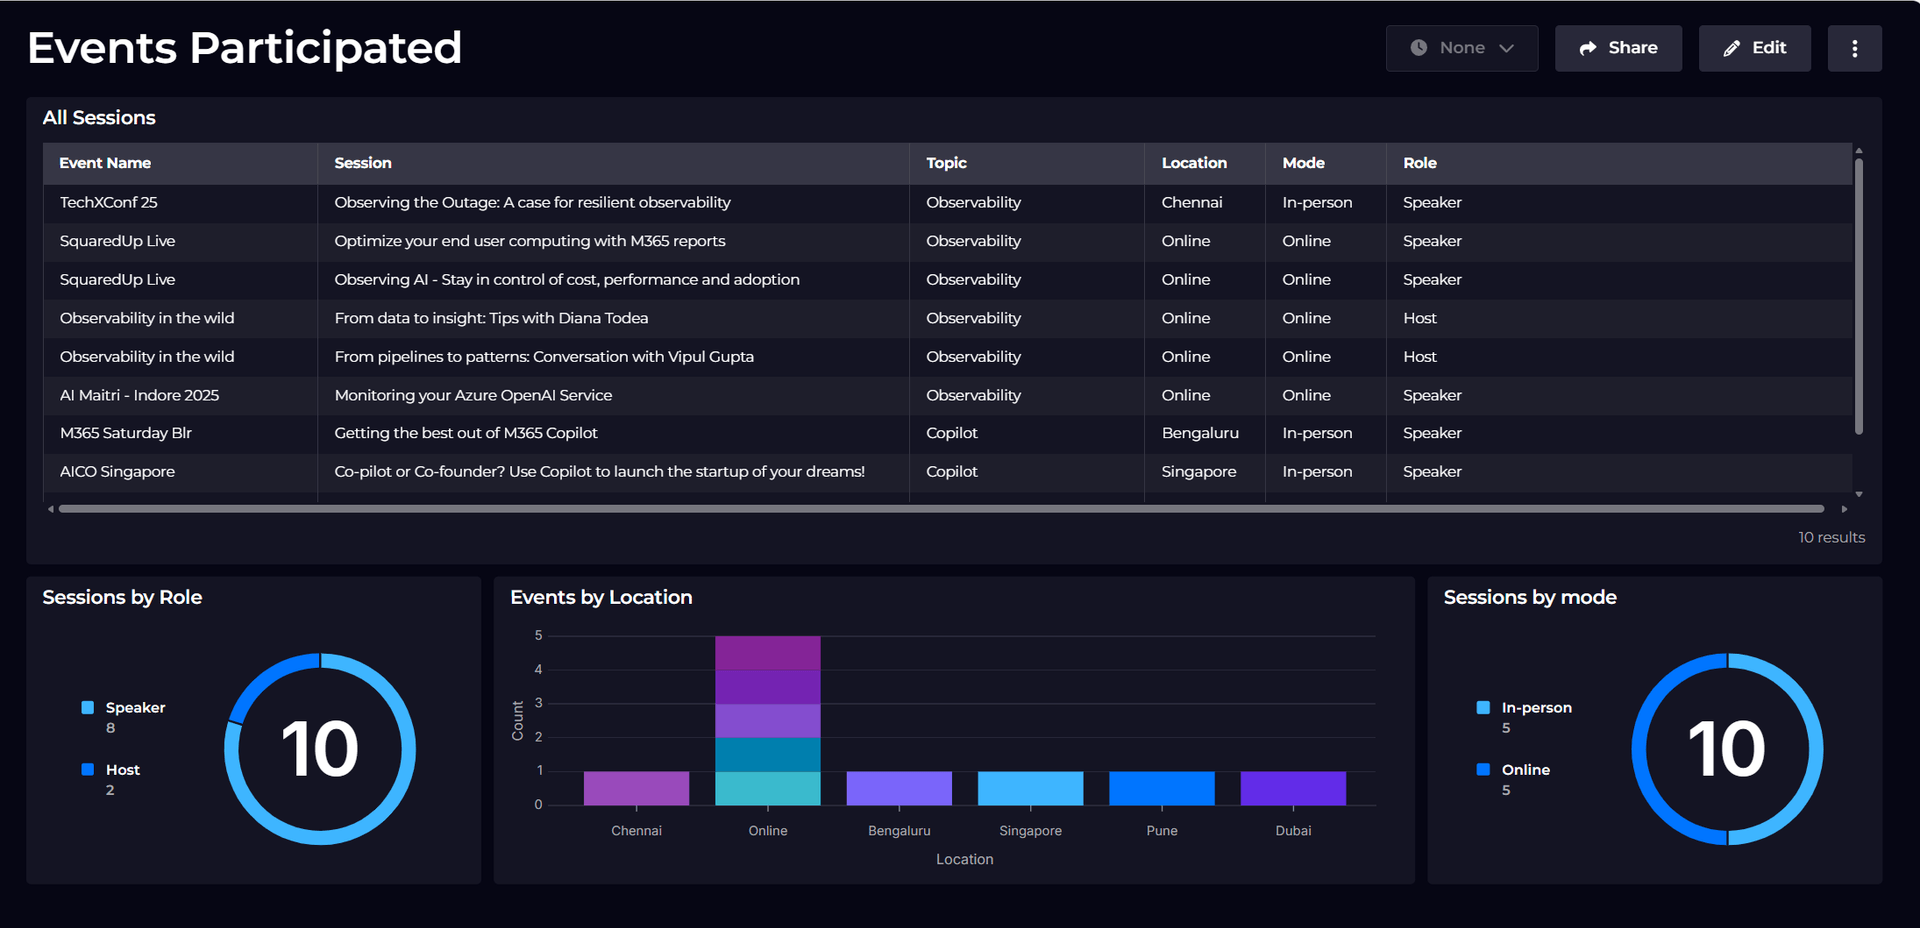
This is the dashboard we will create:

The first step in creating dashboards with SquaredUp is to add a data source. In this case it will be the PowerShell data source. There are two variants – one that runs PowerShell in SquaredUp's cloud environment, and one that runs PowerShell scripts 'on-prem' in your own environment. We'll be using the cloud variant in this example, but you can use the on-prem variant to run PowerShell that accesses APIs and resources in your private network.

Configuring the PowerShell data source is straightforward. The actual script will come later, but at this stage we can optionally add some variables that can be accessed securely by all scripts that use this instance of the PowerShell data source. For example, we could add an API key or other secret.
In this case, I am indeed using a secret PAT token to authenticate against my DevOps organization. So I'll add that now.

Now that we’ve added this change, all we need to do to access it in our script is to call it as $variable.pat. So our script will now look like this:
# Set your Personal Access Token (PAT)
$pat = $variable.pat
# Define the organization URL and API version
$orgUrl = "https://dev.azure.com/squaredup-eng"
$queryString = "api-version=5.1-preview"

# Create the Authorization header using the PAT
$token = [System.Convert]::ToBase64String([System.Text.Encoding]::ASCII.GetBytes(":$($pat)"))
$header = @{ Authorization = "Basic $token" }

# Fetch projects and builds
$projects = Invoke-RestMethod -Uri "$orgUrl/_apis/projects?$queryString" -Method Get -Headers $header
$buildsMetrics = Invoke-RestMethod -Uri "$orgUrl/saas/_apis/build/metrics/daily?$queryString" -Method Get -Headers $header

# Display projects in table format
$projects.value
If we keep the “Install sample dashboards” toggle turned on, we'll get an example dashboard that demonstrates how to use PowerShell. This is another useful way to get familiar with how PowerShell dashboards are built.
To create a new dashboard, hit the ‘+’ button on the Dashboards menu. This creates us a blank canvas.
Add a tile by clicking ‘+’ within the dashboard. This will open the tile editor, where we see the ‘data streams’. For PowerShell data source there’s only one – the one that runs the script. So let’s go and select that.
On the next screen, we choose the object to run this against. Here, we will select the data source we just deployed.

At this point you’ll notice a sample visualization displayed – this is rendered by the sample script in the next section, Parameters. This section is where the script of your choosing will go.
And with the script pasted in, this is the output I get. A simple list of all the projects I have in my DevOps Org.

That was pretty straightforward! Next, all I did was alter the script slightly and create different variations of the data returned and just like that we have our DevOps dashboard, made entirely with Powershell!
There is a lot more you can do with SquaredUp dashboards. Let’s finish off with two of the most common use cases: monitoring and sharing.
SquaredUp monitoring makes it easy to turn our dashboard tiles into monitors, so that we can be alerted about changes. For example, let’s say we want to be alerted if the build failure rate goes higher than 5%. We simply toggle on monitoring and set a threshold of 5 on the Failed Builds % column.

If the monitor triggers, we can receive a notification by email, Slack, Teams or via any system that supports webhooks. You can learn more about monitoring here.
Lastly, let’s share this dashboard with others.
Sharing is very simple in SquaredUp. We simply hit the share button and have the options of inviting a user to the workspace, or sharing just the dashboard via a link:

There are some key differences between the Cloud and On-prem variants of the Powershell plugin. In comparison with the Cloud version that requires virtually no configuration, the On-prem variant requires a little configuration to deploy a relay agent in your network which runs the scripts on the local server and sends the results back to SquaredUp securely. The On-prem version is the go-to choice when you want to retrieve data from the systems in your organization’s network.
That was a very simple example, but hopefully you have a flavor of how easy is to start dashboarding your Powershell scripts running in the Cloud or On-prem with SquaredUp. In addition to the Powershell scripts, you might also be interested in adding Azure, Azure DevOps, M365 or SQL. SquaredUp has over 60 data sources that you can connect to and fetch the data from. You can get started with a free account, or check out our flexible pricing for dashboarding at scale.
Happy dashboarding!
DevRel Engineer, SquaredUp & Microsoft MVP

Visualize and monitor data from PowerShell scripts with fast and flexible dashboards.

Getting started with SquaredUp is free and easy. Our free tier includes: