Sameer Mhaisekar
DevRel Engineer, SquaredUp & Microsoft MVP
SquaredUp is a data visualization tool that can connect to a variety of data sources to bring the data together in a single pane of glass. In this blog we will demonstrate how SquaredUp can connect to any REST APIs out there and build dashboards on the data returned.
If you prefer consuming video content, you can check out this video by Senior Product Manager Dave Clarke where he similarly introduces the Web API plugin.
Let us illustrate SquaredUp's ability to connect any REST APIs while handling a variety of authentication methods by using the Bitbucket API as an example.
Bitbucket is a cloud-based service that provides a platform for developers to store, manage, and collaborate on their code. It is a Git-based source code repository hosting service owned by Atlassian.

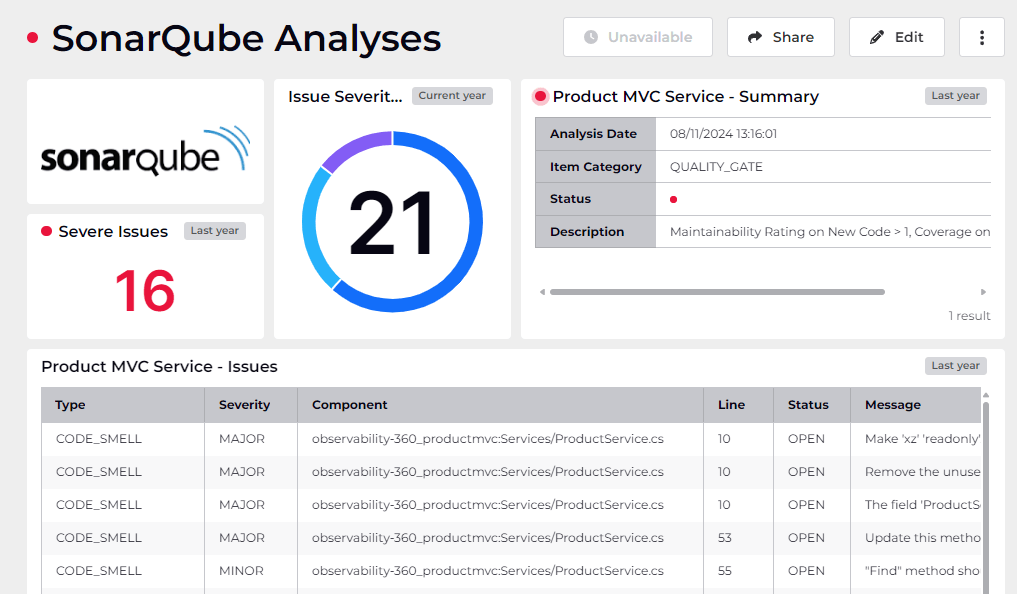
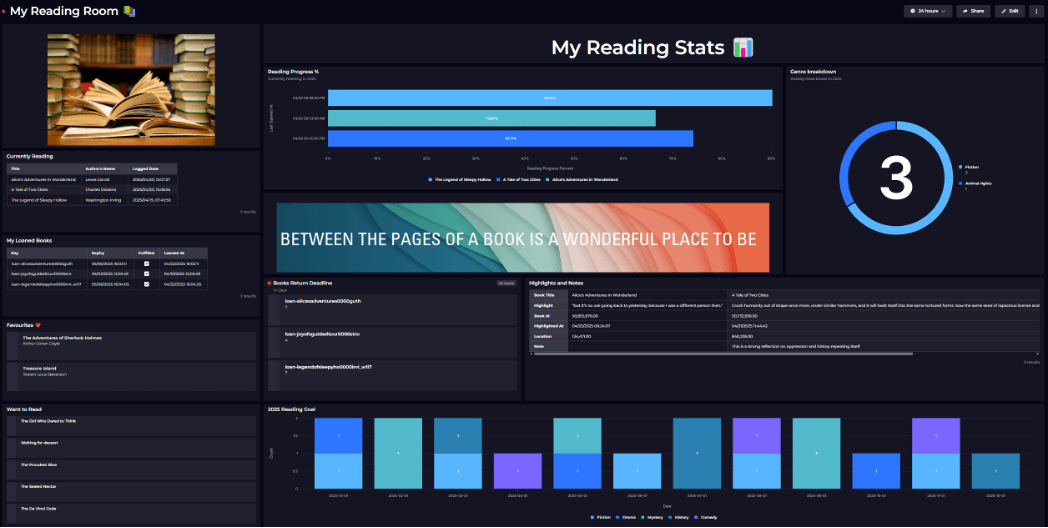
This is a simple dashboard that calls the Bitbucket API endpoint and retrieves some basic information about the repositories hosted. Let's take a look at how to get there.
Head over to Settings > Add data source, and look up "WebAPI" in the search box. You'll notice two variants come up, one cloud and another "on-prem". Since the API we'll be using is accessible over the internet via authentication, we will select the cloud version.

As you can see, SquaredUp supports a few authentication methods, all driven by UI. You can authenticate simply by using username and password under the "Basic" authentication method, or pass a bearer token or API key in the headers for authentication.

We will not spend a lot of time explaining how these authentication methods work, assuming you're already familiar with it for your APIs.
In my case, Bitbucket supports authentication with API key as well as OAuth2.0, so for the sake of this demonstration I'll use the latter.
The OAuth2.0 authentication method requires you to register your app (SquaredUp in this case) with your API provider (Bitbucket) which in turn gives you a client ID and a client secret to authenticate with. In my case it looks like this:

You may also have to specify other things like the Token URL, Authorization URL, and Authorization Scopes so that SquaredUp can access specific endpoints for related data and acquire/renew tokens.
The KB on the right should help you get started with the plugin configuration, provided you have all the access and tools you need on your API side.
You can go ahead and test the configuration by querying an endpoint. As you can see, my authentication seems to be working well as I can see some data coming back in JSON format in the Results window.

Now we're ready to create our dashboard!
Let's start by creating a new dashboard, and then a new tile. In the data streams, let's search for "HTTP Request".
This will present to us the list of WebAPI data sources we have added. The one that we added just now is "Bitbucket". So I'll go ahead and select that.

On the next page, it will ask me for the endpoint to query and will also let me test it out for results. You can add headers and query arguments to filter out the results here if you want as well.
So let's go ahead and add the API endpoint and look at the JSON result that comes back.
My endpoint is https://api.bitbucket.org/2.0/repositories and the response is:

You'll notice we already have our results in the JSON but SquaredUp visualization isn't quite picking it up. That's what the Path to data option is for. The actual data that we're interested in is contained in an array of values key. So with that in mind, we change the path to data to values.

And with that change, our data is now in tables – just like we wanted!
That's one tile done. We can now use some shaping on this data to create a couple more that are useful to us. Like the following for example:

On the same result, I just grouped them together by the "Language" column and now we have a bar chart displaying all the repos by the languages they're deployed with. Rinse and repeat the process a few times, try out different endpoints, and voila you have a nice and useful Bitbucket dashboard!

This was just an example with one API I had, but you can use any API of your choice and query it to dashboard the data returned. That's really powerful!
SquaredUp monitoring makes it easy to turn our dashboard tiles into monitors, so that we can be alerted about changes. For example, I can configure the dashboard above to send me a notification if the number is outside the threshold I configured.
For example, I've configured a monitor to let me know if there are any repositories that have no Wikis to them. So I'll switch over to Monitoring and switch on the toggle and provide my condition.

As you can see it has changed the color to red, indicating that the error condition has been breached and it will now raise an alert.
Not only can I see this in SquaredUp, I can also set up notifications to let me know if any alerts are raised so I can be aware anytime. They can be sent as an email, as an IM message or forwarded over to any of your automation workflows.
If the monitor triggers, we can receive a notification by email, Slack, Teams or via any system that supports webhooks. You can learn more about monitoring here.

Sharing is very simple in SquaredUp. We just hit the share button and have the options of inviting a user to the workspace, or sharing just the dashboard via a link:

Now that you've seen how easy it is to turn any API into visualizations - try it out yourself and see what you'd like to do with it!
In addition, we also have many other plugins including Powershell, Azure, Confluence, AWS and many more!
Sign up for free and explore the power of SquaredUp yourself.
Happy dashboarding!
DevRel Engineer, SquaredUp & Microsoft MVP


Getting started with SquaredUp is free and easy. Our free tier includes: