Adam Kinniburgh
VP Innovation, SquaredUp

So you had a great day playing with really awesome new tech, solving big business challenges, and feeling like you really nailed it. Then you wake up the next day to an alert from Azure telling you you've blown your monthly budget and it's only the first week of the month.
We've all been there... right?
Using any cloud service comes with a cost, but for most services the budget risk is low. Cost calculated daily isn't a problem when usage is predictable, but not everything works like that. I'm sure we've all fallen foul to the seemingly infinite elastic scale of serverless compute at one point or another... a tiny typo in a simple function leads to endless looping, churning through compute time and racking up the pennies.
And now we have AI... the hot new thing that everyone is excited about, resulting in tech teams falling over themselves to roll out new services all while trying to balance cost, security, regulation, and company policy.
"Just put AI in it" comes a yell from the boardroom.
As is often the case when time is tight, a common approach is to just slip new things onto your cloud bill. Certainly easier than having to get approval for a new vendor and a whole new budget line. The positive side is that using your preferred cloud is typically the best choice for most enterprises anyway. Data sovereignty, security control, access management and auditing... all come for free. But the flip-side is that pesky elastic scale, biting you on the behind. So when your users are desperate to start pasting customer data into who knows where to help them write better emails, where that data is going is certainly important.
Given the strong relationship between Microsoft and OpenAI, and the growing catalog of models supported by Azure AI Services, it's not surprising that it's a leading choice for enterprise LLM hosting. Azure AI Foundry offers a really rich developer experience and simple integration into your stack. What could go wrong?
My recent explorations have taken me down two paths. How AI could add value to SquaredUp's products, and how we could use AI as an internal business tool. In both cases, a lot of experimentation is going on, and sometimes, it goes awry.
AI token consumption is hard to predict, different models have different pricing, and cost reports are generated daily. There's a gap between tokens and money, and a gap between usage time and cost visibility.
Thankfully, monitoring token usage is as real-time as most other metrics in Azure Monitor. The simplest solution is to set up an alert rule in Azure Monitor to trigger when some sensible threshold is passed. Perhaps token usage per hour would be a good starting point, with a value based on some loose napkin maths to get from tokens to money.
But naturally there's a way better way to do it, with reliable maths, and timely alerts based on the number that matters... the cost.
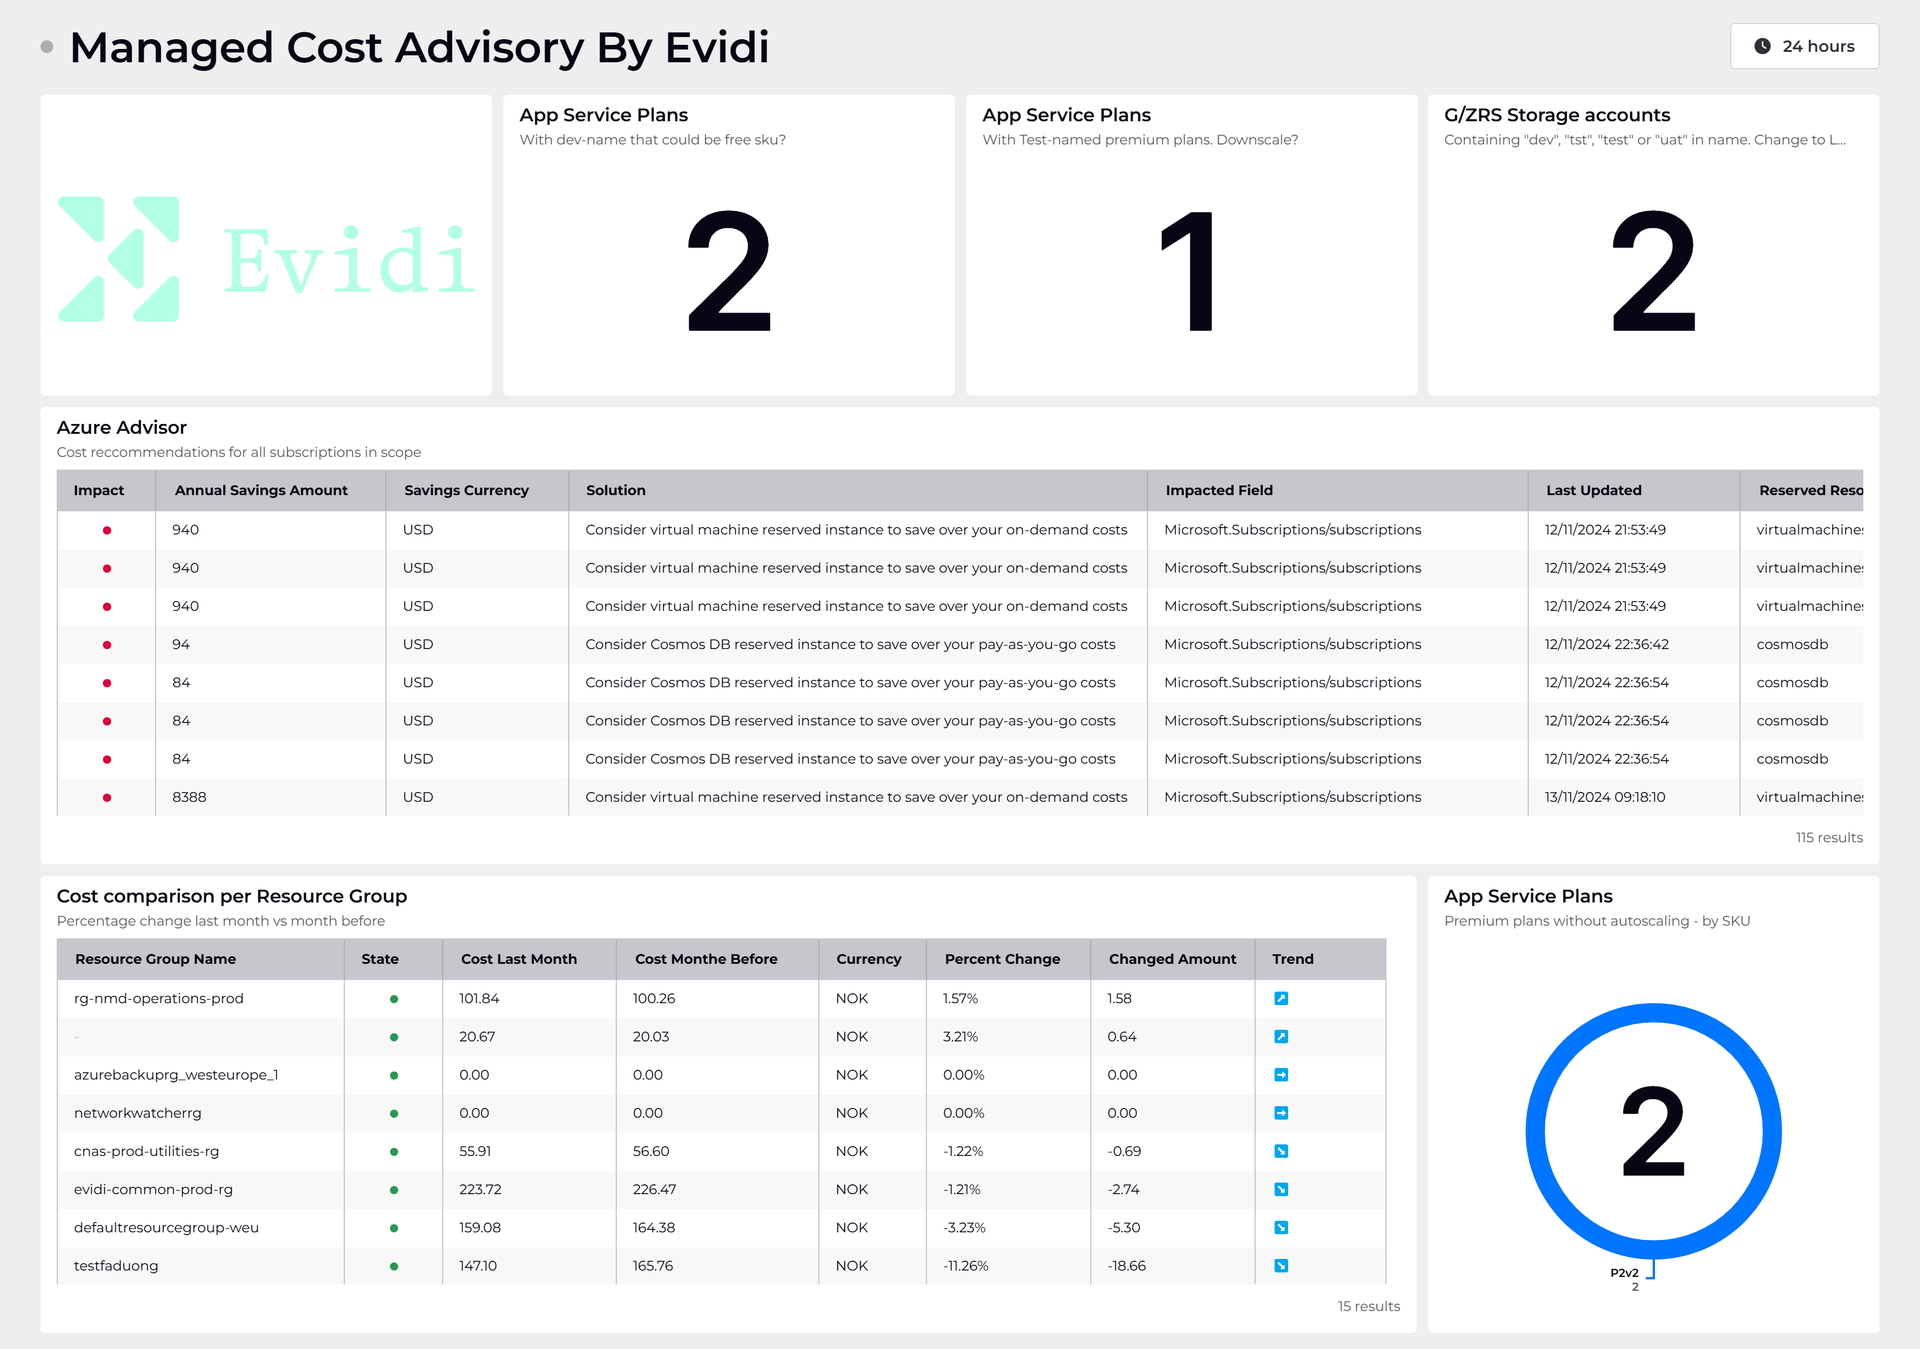
SquaredUp has an awesome plugin for Azure that deeply integrates into Resource Graph, Monitor, Logs, AppInsights, and Cost, but it can't invent new data, it just makes it really simple to dashboard your existing data. Here's where I started with my AI dashboard... the core metrics.

With my Azure AI Services resources in scope, I chose the "Monitor Metrics" data stream which surfaces any and all metrics available. For this scenario, I was looking for something related to token usage and came across the following;
This seemed like a solid start, and I could enable monitoring and notifications with just a click, but there's still the big question mark.. how much are these wiggly lines actually costing? Given the vast difference in cost between gpt-4o-mini and o1-preview for example, it's not just a case of looking at the token counts.
A really powerful feature of SquaredUp is SQL Analytics. Take multiple datasets from any tools, and put them behind a virtual SQL layer that gives you the flexibility to combine and aggregate as you need.
The first step was to bring my graphs for input and output tokens together, and add a new label column to each "table" denoting input vs output.

My new unified chart is useful already, but I need to apply the cost to the token counts. Considering that each model has a different price, I want this to be dynamic and easy to maintain, so I called on SquaredUp's CSV plugin. With a couple of minutes work in Excel I prepared a simple CSV of models and their prices per 1,000 tokens.

Next, I just needed to add that CSV data as a third dataset in my SQL tile, and bring it all together.

Kaboom! Token usage is now represented in monetary terms, per model, over time. I can monitor this tile for any one datapoint being over a certain value, I can skew it round to show cumulative values and then monitor those totals, and crucially, I can now spot spikes really quickly. I have the answer I need, and it's as real-time as Azure can make it.
My final dashboard took a few more turns and ended up as follows.

I stuck with my view of cumulative cost per model over time, but I also cloned that tile and tweaked the SQL to group by input vs output instead. I also added a donut to show me the total input vs output, and by extending the timeframe to 30 days, I was able to pick out the total for the last 7 days, and for the 7 days before that, to power my scalar tile with a comparison. I'm monitoring that comparison too.
All of this won't prevent any typos in my code or unexpected splurges by our chatty Slack Assistant, but at least I'll know about it next time. And fast!
I mentioned turning on monitoring with a "single click", well here's how.
Simply edit the tile you want to keep an eye on, click into the Monitoring panel, and flick the switch. In most cases, the default settings will be good and you'll just want to set your own thresholds.
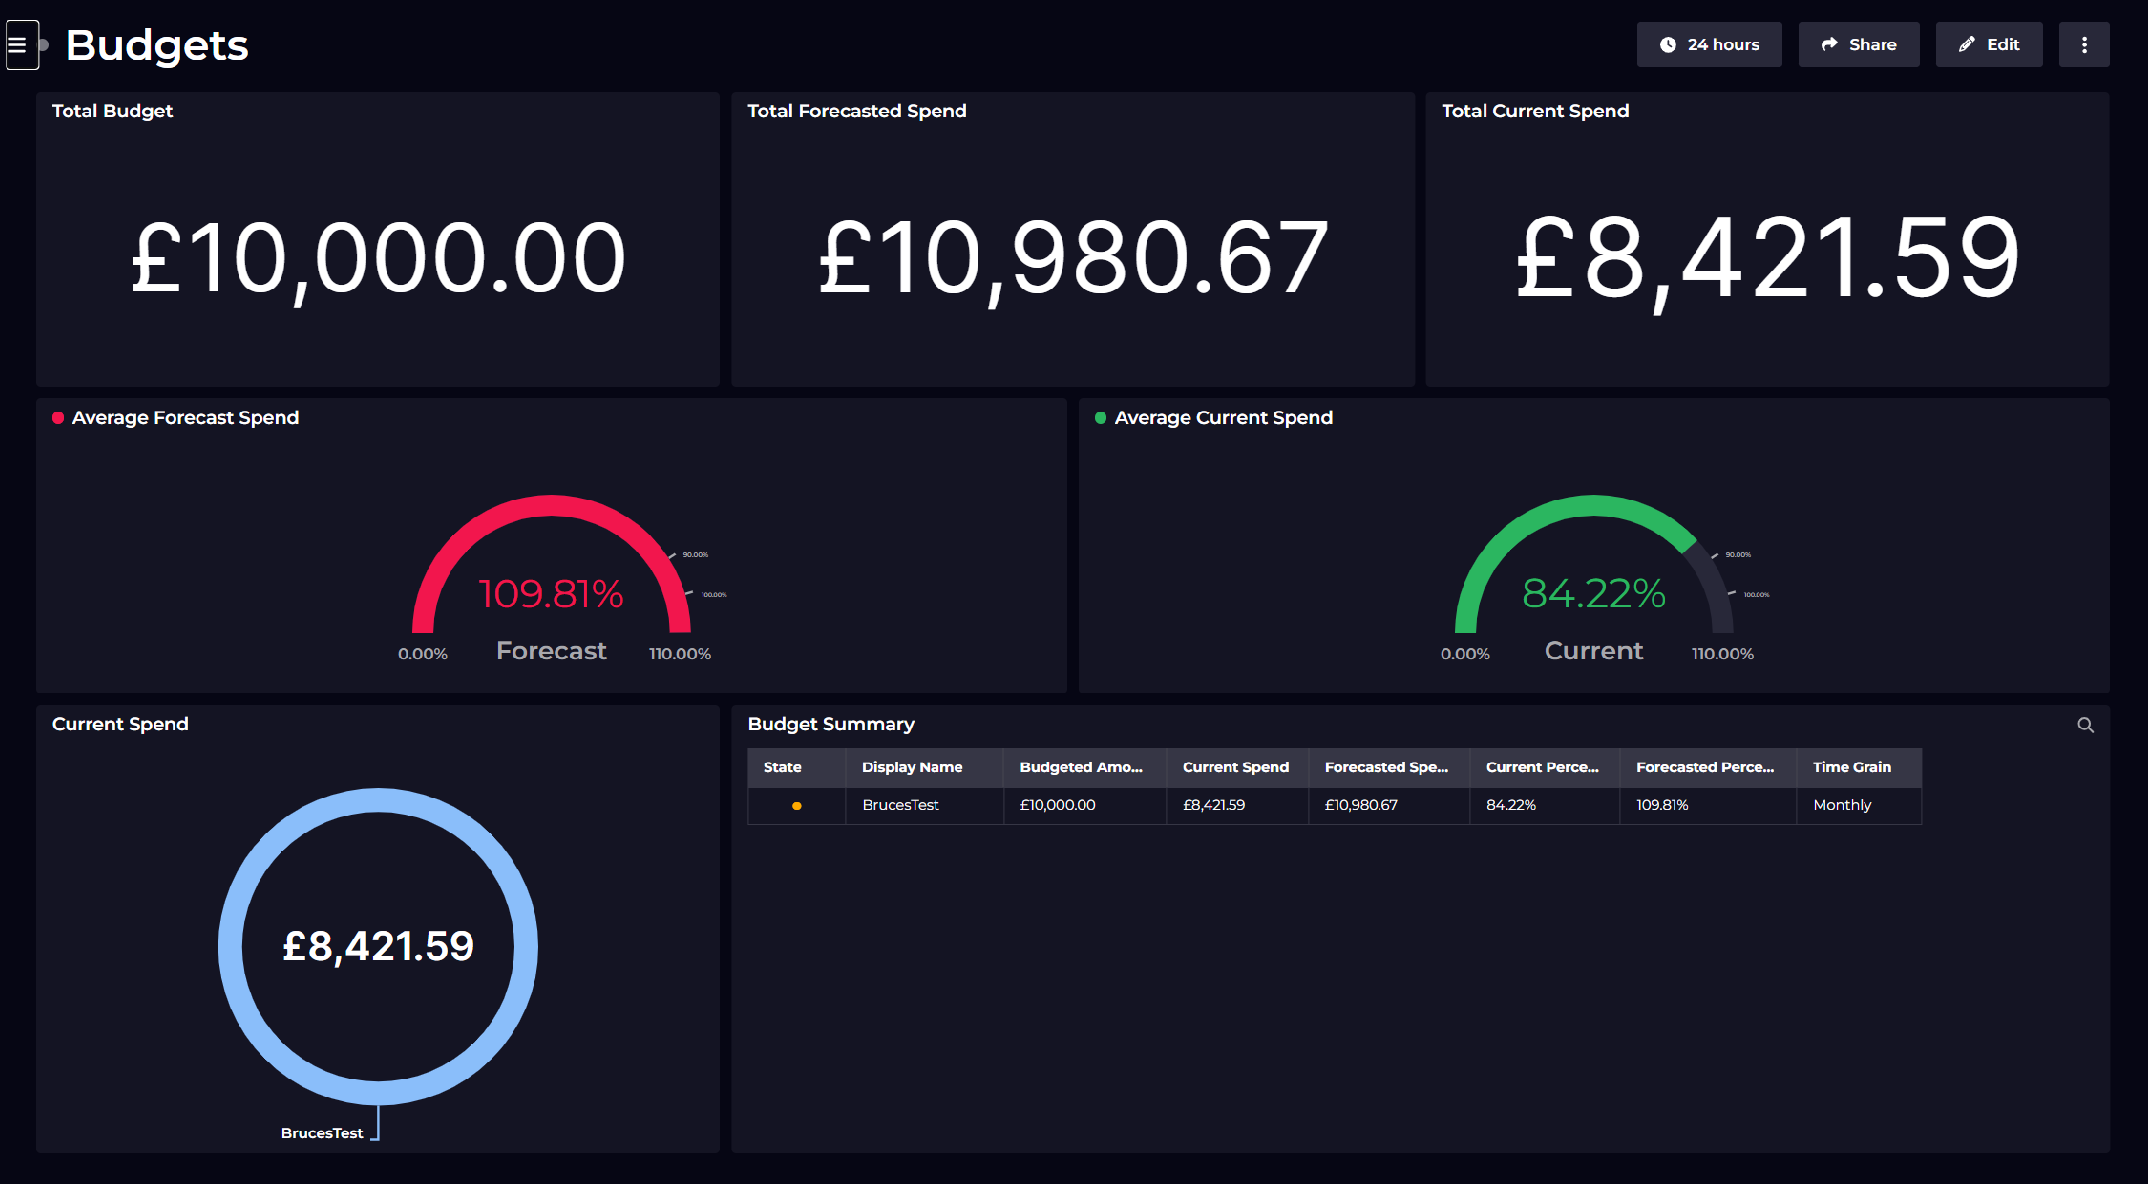
For my scenario, I chose to show a warning if the sum of cost goes over £150, and then an error if it exceeds £200. My tile is locked to a rolling 7 day period so these thresholds are about right to ensure that my monthly running total doesn't blow the budget again.
I already had a notification rule configured for this workspace, to send alerts into Slack, so by enabling a monitor I'm all done for the day. Notifications will start flowing if they need to. Let's hope I never see one!

Here's the notification setup, showing all of the monitors in the workspace, and a single notification rule sending any changes to Slack.

And if you were configuring a new notification rule, here's how simple that is...

VP Innovation, SquaredUp


Getting started with SquaredUp is free and easy. Our free tier includes: