Dave Clarke
Senior Product Manager, SquaredUp

In a world of monolithic applications and microservices, responding to incidents can be a painful process, involving multiple people with siloed knowledge jumping between different tools to find the relevant data and take action. Individuals within a business often hold the knowledge of how a particular component works, or how it depends on other services. The key to successfully responding to incidents is unlocking this knowledge and breaking down the silos between teams.
With that knowledge unlocked, responders need to be able to access relevant information quickly to enable them to make decisions and apply a fix. For example, assessing where a particular performance bottleneck might be or understanding how different users are being impacted.
This blog will take a deeper look at how SquaredUp solves the problem of unlocking knowledge and provides a simple way to access data from across your organization. The walkthrough focuses on an internal app called the Swag Store.
To demonstrate the power of SquaredUp in the context of large-scale enterprise systems, we built a dummy application that offered make-believe swag to all visitors.
Quickly, the Swag Store grew and evolved into a real application – used for offering all manner of swag to conference attendees at different events we attend throughout the year.


The Swag Store is a broad application, with a number of different services using a number of different tools:
SquaredUp is a built around a system of plugins that allow you to connect to all of the different services and tools you might use as an organization. To monitor the Swag Store we’ve configured plugins for all the platforms and tools in use: AWS, CircleCI, Zendesk etc.
Having connected to all the relevant tools, we’ve built out workspaces that represent each component of the app, and added dependencies to other services that represent the real structure of the application – thus capturing the knowledge that might otherwise be locked away in someone’s head!
Within each workspace, using our simple tile editor, we’ve built out dashboards pulling key metrics such as Lambda Duration, Canary Success/Error Rate and more. On top of these metrics we’ve configured thresholds and monitoring to indicate when there might be an issue. Through our knowledge graph, these health states rollup to the overall service so that at a glance you can quickly see if a specific service is healthy.
We’ve also gone ahead and connected to Slack to notify us when a workspace changes state.

With the workspaces and relevant metrics configured, SquaredUp monitors for any issues and notifies our Slack channel if any issues are detected. This is our starting point for responding to an issue.

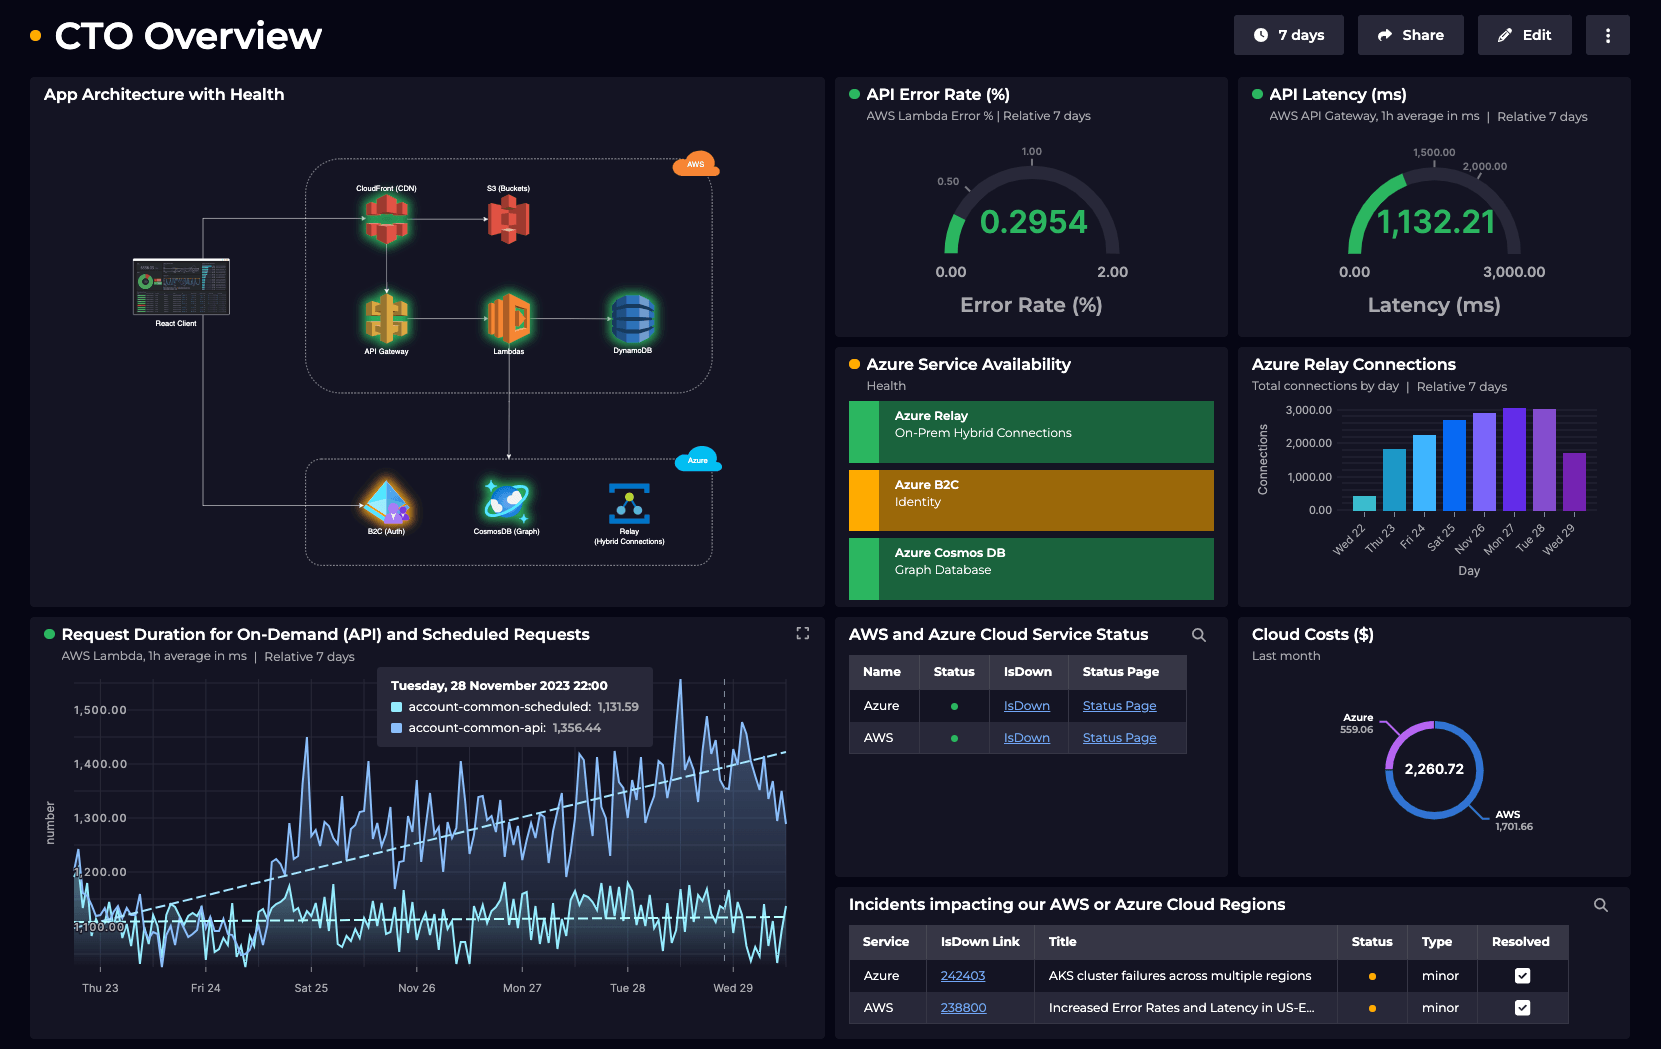
From the notification we can quickly jump to the affected service and quickly understand how this issue is affecting our business. Looking at this top-level dashboard we can quickly gain a few critical insights:

From here, we can start to investigate this issue to determine what the cause might be. The first place to start is the Health tile which shows us the various monitored aspects of this service. In this case, we see that the monitor for Canary Success % is unhealthy, as well as the monitor for Duration indicating there’s likely an issue with the Lambda function that both the base CloudWatch metrics have picked up as well as our configured Synthetic Canary.
We quickly see that the Lambda duration is rapidly increasing…

… and our monitor for 2xx responses (via the Synthetic Canary) has suddenly dropped.

At this point, it’s clear the issue lies with the Lambda and we can start to browse other related data that might point us towards the cause. Because SquaredUp is connected to all of the tools we use, there are a few things we could look at to investigate further:

From this dashboard showing recently closed pull requests (GitHub) and recent workflows (CircleCI) we can see there was recently a change that triggered a deploy. We can jump directly to this change in GitHub to see who made the change and what that change was. That gives us a lot to go on in terms of understanding what went wrong here, as a well as a starting point to rollback the change and restore our service!

Without having to reach out to various members of the team, or bounce around different tools looking for answers, we’ve quickly established that:
Hooray, we identified the root cause of the incident with just a few clicks, within a single tool! All of this made possible thanks to what we’ve setup in SquaredUp.
If you’d like to see how SquaredUp can work for your environment, get started today for free with our out-of-the-box dashboards that will have you up and running in minutes.
Or, to learn more:
Senior Product Manager, SquaredUp


Getting started with SquaredUp is free and easy. Our free tier includes: