Blog


We did it! SquaredUp is now a B Corp
It's been a journey - but we're delighted to finally announce our B Corp certification. Here's the story of how it happened...
Top 5 dashboards for DevOps leaders
How DevOps leaders can use SquaredUp to view SLOs and key metrics in a single pane of glass.

Operational Intelligence - the new horizon of observability
The evolution of observability into intelligent, real-time decision-making.

How Evidi built the perfect MSP single pane of glass
Evidi has created the ideal suite of dashboards for MSPs – a customer health overview dashboard that drills into one workspace per customer. Learn more.


Latest blogs
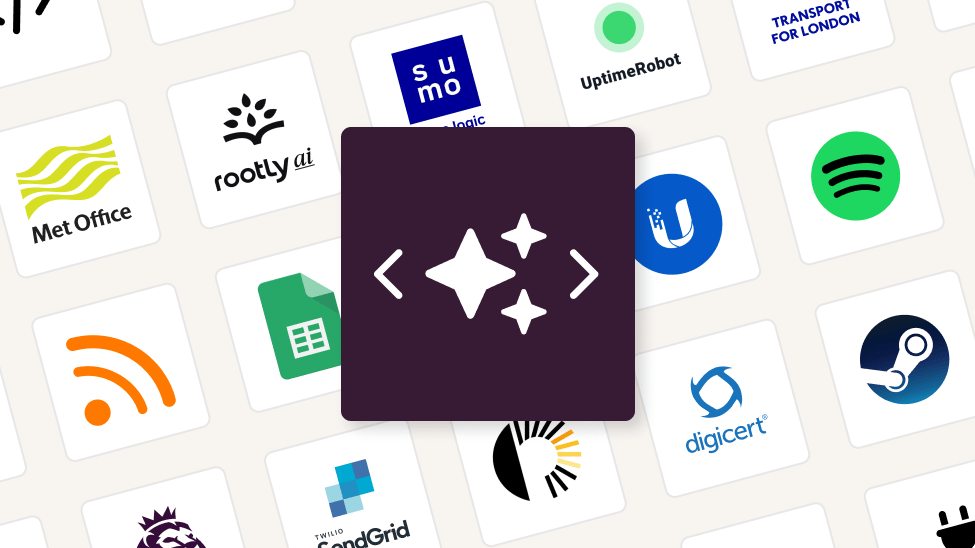
16 new integrations — powered by AI‑ready Low Code Plugins
If it has an API, you can integrate it — and soon, share it with the entire SquaredUp community.

Dashboarding Azure: SquaredUp vs Grafana
Both SquaredUp and Grafana Cloud have Azure data sources. In this article we compare dashboarding Azure data in both tools and which one is more robust.

Building high performance dashboards with SquaredUp and ClickHouse
With SquaredUp's Web API data source you can frictionlessly connect to a ClickHouse database and be creating smart dashboards in minutes.
A new perspective on dashboard sprawl
Ditch your static, outdated dashboards! Our smart dashboards collate and show you the data that matters. Read to learn about the feature that powers the magic.
Getting started with Dynatrace dashboards
How the SquaredUp Dynatrace data source simplifies and streamlines visualising Dynatrace data. Build smart dashboards in minutes.
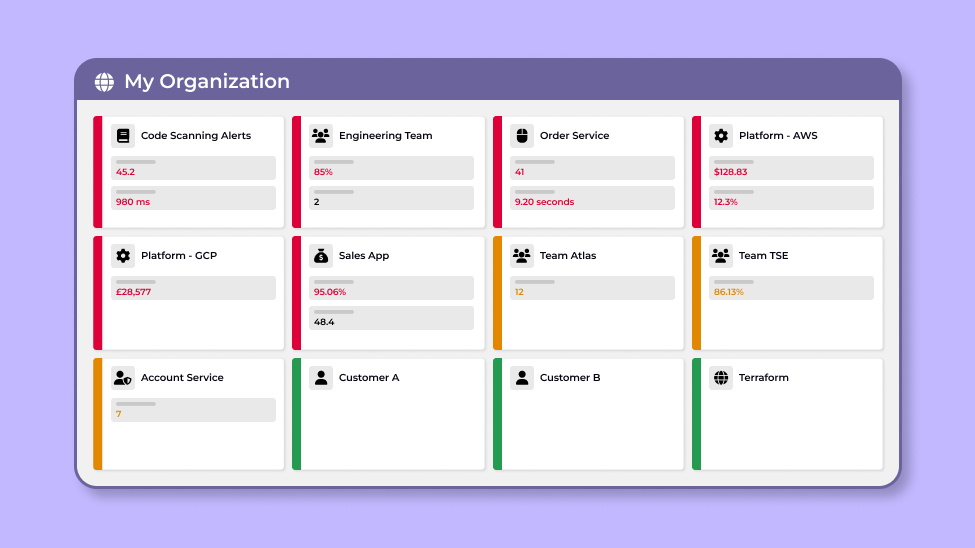
Dashboard organization isn't about folders — it's about visibility
How SquaredUp’s unique Workspace and RollUp features combine to provide the big picture.
Getting Started with Splunk Dashboards
How to create impactful dashboards in SquaredUp using the Splunk plugin.

Getting the right signals: Mobile observability with Embrace and SquaredUp
Visualise rich analytics on your mobile applications with SquaredUp's smart dashboards
SquaredUp celebrates four years as a certified Great Place To Work®
We’re thrilled to share that we’ve once again been recognized by Great Place To Work® across multiple categories for 2025!

Visualising Sentry analytics with SquaredUp
Use the SquaredUp Web API data source to build dashboards and create advanced analytics from your Sentry metrics
From Excel to live dashboards — introducing our new SharePoint plugin
Learn how the new SharePoint plugin makes it simple to bring business context into your dashboards.

How to build the ideal engineering team dashboard
What makes a good engineering team dashboard? Follow this guide to help your developers focus more on coding and spend less time on tool switching.
