Blog


A dive into health roll-up
SquaredUp dashboards sit on top of some very powerful technology. Read to learn all about our health model and how it can benefit you.
A new perspective on dashboard sprawl
Ditch your static, outdated dashboards! Our smart dashboards collate and show you the data that matters. Read to learn about the feature that powers the magic.

How to build the ideal engineering team dashboard
What makes a good engineering team dashboard? Follow this guide to help your developers focus more on coding and spend less time on tool switching.

SquaredUp celebrates four years as a certified Great Place To Work®
We’re thrilled to share that we’ve once again been recognized by Great Place To Work® across multiple categories for 2025!


Latest blogs

Getting started with HaloPSA dashboards
Lost in HaloPSA data? Build dashboards that help manage the service desk without the usual set-up pain.

SquaredUp Live '25
We had a blast at our annual customer event – and we hope you did too! Read to see what we got up to.

Dashboarding OCI costs: A guide to building a usage API with OCI functions and SquaredUp
A step-by-step guide to building an Oracle Cloud Infrastructure (OCI) usage API and connecting it to SquaredUp to create insightful cost dashboards.
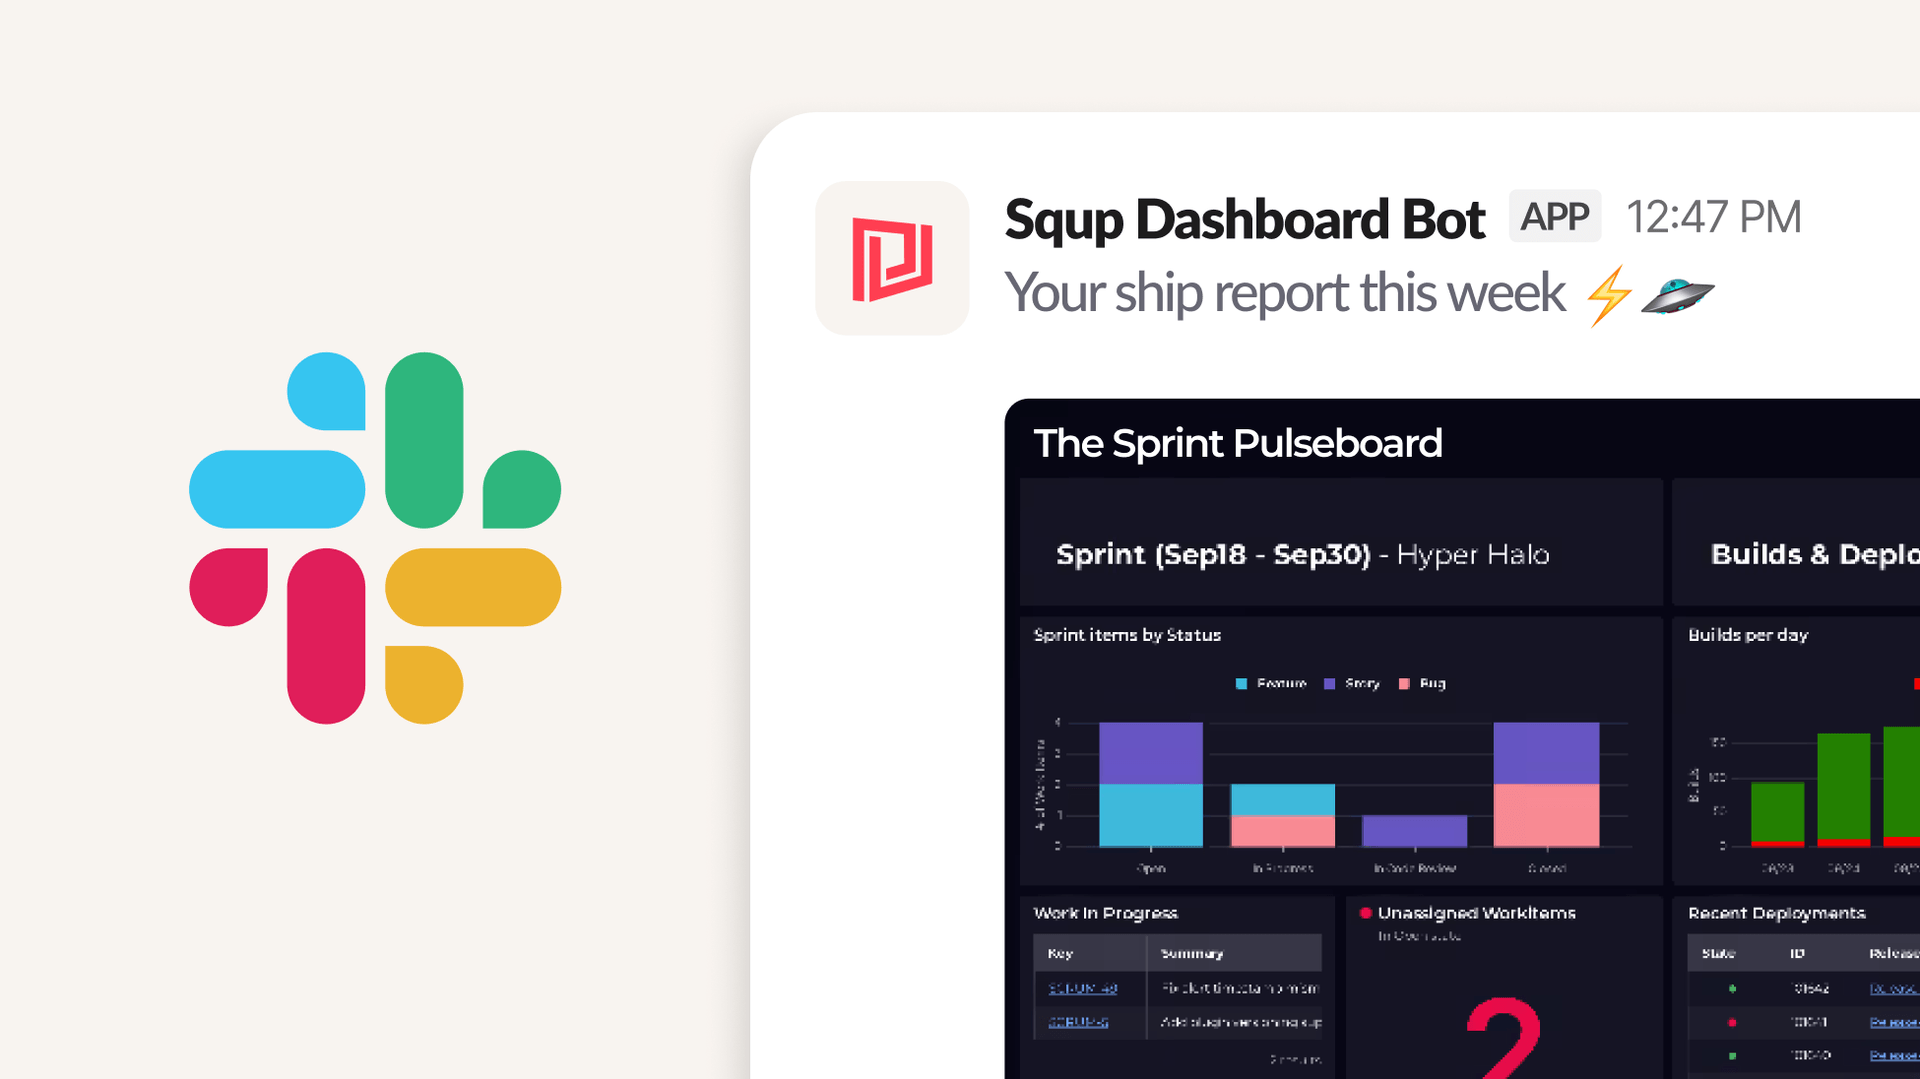
How to automate sending SquaredUp dashboards to Slack with the Notification API
Learn how to automate sending dashboards on your chosen trigger – be it on a schedule, before meetings, or on-demand through chat commands.

Top 3 MSP dashboards compared: SquaredUp, BrightGauge and MSPbots
If you’re an MSP looking for greater visibility and improved reporting, check out these three leading MSP dashboards.
The 3 REAL Alternatives to Grafana Dashboards
Looking for an alternative to Grafana dashboards? Here are the three options you should be considering.

Burndown and burnup: Two charts every engineering dashboard needs
What are burndown and burnup charts? A look at when to choose each chart, and how to best leverage them to improve your engineering process.

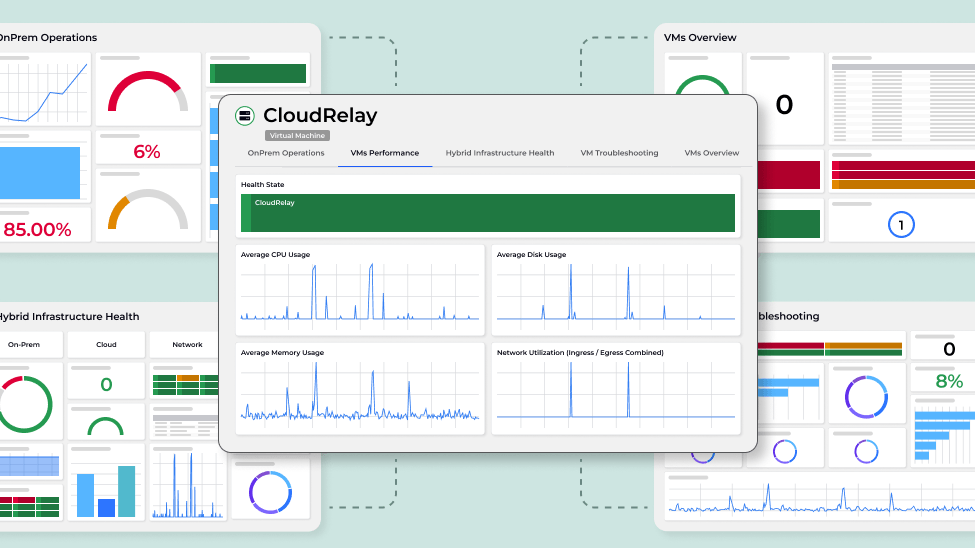
SquaredUp Cloud + Dashboard Server
A look at how SquaredUp Cloud and Dashboard Server differ, when to use each, and how they work together to deliver hybrid cloud visibility.

Top 3 Jira reporting tools: SquaredUp vs Power BI vs Jira
Is Jira reporting creating a bottleneck in your team? Explore the best Jira reporting tools for your team.

Getting started with Jira dashboards
Get set up with flexible Jira dashboards that give you the full picture of your projects. Combine with other data sources or use JQL to customize metrics..

Getting started with Web API dashboards
In this guide we will see how SquaredUp can connect to any REST APIs and bring the data back to create fully featured, smart dashboards.

The first rule of DORA Metrics...
DORA Metrics are a useful signpost for measuring performance, but there is no rulebook for how to implement them effectively. Learn how SquaredUp can help.
