Blog


A dive into health roll-up
SquaredUp dashboards sit on top of some very powerful technology. Read to learn all about our health model and how it can benefit you.
A new perspective on dashboard sprawl
Ditch your static, outdated dashboards! Our smart dashboards collate and show you the data that matters. Read to learn about the feature that powers the magic.

How to build the ideal engineering team dashboard
What makes a good engineering team dashboard? Follow this guide to help your developers focus more on coding and spend less time on tool switching.

SquaredUp celebrates four years as a certified Great Place To Work®
We’re thrilled to share that we’ve once again been recognized by Great Place To Work® across multiple categories for 2025!


Latest blogs

Getting started with Freshdesk dashboards
A step-by-step guide to connecting the Freshdesk plugin and creating your first dashboard.
Getting started with MongoDB dashboards
A step-by-step guide to visualizing your MongoDB data with SquaredUp dashboards.

Getting started with the Grafana plugin
Learn how to consolidate your Grafana alerts and get a high-level view of the state of your services using SquaredUp.
Top 3 Intune reporting tools: SquaredUp, Microsoft admin center, and Power BI
Compare the top tools for compliance monitoring, security insights, and app deployment tracking.

Getting started with Elasticsearch dashboards
Use the SquaredUp plugin to analyze and visualize your Elasticsearch log data
Top 3 reporting tools for Microsoft Teams: SquaredUp, Power BI & M365 Admin Center
Compare the top 3 Microsoft Teams reporting tools: SquaredUp, Power BI, and MS Admin Center. Discover which solution best fits your analytics needs.
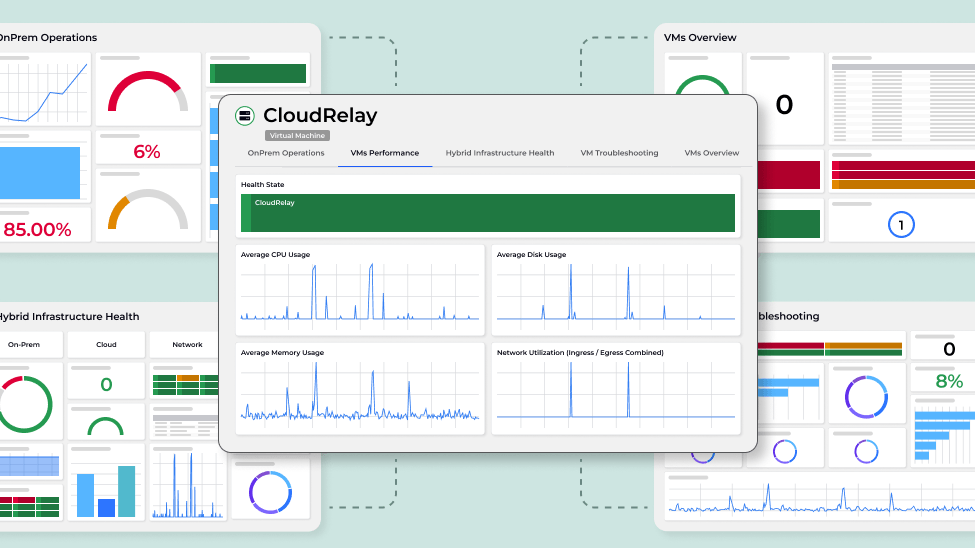
Getting started with VMware dashboards
Get started with VMware dashboards in SquaredUp for real-time insights into host health, performance, and capacity – quick to deploy and easy to use.

Operational Intelligence - the new horizon of observability
The evolution of observability into intelligent, real-time decision-making.

We did it! SquaredUp is now a B Corp
It's been a journey - but we're delighted to finally announce our B Corp certification. Here's the story of how it happened...

Getting started with Cloudflare dashboards
Cloudflare gives you lots of data. This is how to turn it all into clear, actionable insights to make decisions faster.

Custom timeframes are here!
We understand that one-size-fits-all timeframes don’t always meet your needs. Our new feature means you get more from your SquaredUp dashboards.

The 3 smart updates to our Jira plugin
We’ve supercharged our Jira integration – making dashboards faster, data streams simpler, and your workflow smoother than ever.
