SLO walkthrough: measuring microservice performance
To improve reliability, we need to measure it, and to measure it we use SLOs (Service Level Objectives). Or at least, that’s what Google SRE has popularized.
In practice, it can be difficult and time-consuming to identify the right things to measure, to get to the right data, and to surface the results in a way that engages the stakeholders and teams involved. And all this is especially hard as we scale our teams and applications across multiple technology stacks.
SquaredUp helps in the following ways:
- Report SLOs independently from your observability and monitoring tools
- Empower individual teams to define and measure their own SLOs
- Align infrastructure SLOs with business SLOs
- Visualize dependencies between components and their SLOs
- Publish in a single place, with easy-to-share dashboards
This blog walks through the basics of measuring SLOs with SquaredUp, using a simple application as an example, and a simple dashboard as the end result:

Here’s what we’ll cover:
- An example microservice application
- Calculating an SLI using AWS CloudWatch data
- Applying a target for the SLO
- Rolling the SLOs up to a top-level dashboard
SquaredUp has over 50 out-of-the-box plugins, so although we’ll focus on AWS, you can measure SLOs across clouds (AWS, Azure, GCP), hosting stacks (serverless, containers and VMs) and monitoring tools (Prometheus, Splunk and many more).
Warning: terminology minefield ahead! It can be difficult to sort out your SLOs from your SLIs, and we’ll be adding KPIs to the mix too. Here’s a quick summary of how we’ll be using these terms and where to go for more reading. (For SLO terminology, we’ve borrowed Fred Moyer’s clear-thinking guidance: https://www.usenix.org/sites/default/files/conference/protected-files/sre19amer_slides_moyer.pdf )
- SLI – Service Level Indicator – A measure of the service that can be quantified
- SLO – Service Level Objective – A target for the Service Level Indicator
- SLA – Service Level Agreement – A legal agreement
- KPI – Key Performance Indicator – A more general term for an important measure, beyond just service levels.
The Swag Store application
The application we’ll be measuring our SLOs for is the SquaredUp Swag Store. This an e-commerce application that sells branded SquaredUp merch such as baseball caps, socks and even baby-grows. Unfortunately, the merchandise is fictional and the store is just for demonstrations, but the app is real code. It’s a regular SPA front-end that depends on a bunch of backend services – Account Service, Shipping Service and Inventory Service – developed as microservices on AWS, primarily using AWS Lambda and DynamoDB.
Here’s the architecture showing the component dependencies. This diagram is generated by SquaredUp. We will cover how we modelled the Swag Store app using our workspace graph in a later blog.

Introducing workspaces
A key point about this diagram is that each of those cubes is a ‘workspace’. Workspaces allow the monitoring for each component, including SLOs, to be independently defined and controlled. SLO calculations may be the same for some components – e.g. those that comprise a single Lambda – be different across components, including different observability tools and data sources.
Let’s walk through creating an SLO for a single component, taking the Account Service as an example.
Configuring an SLO
First, we drilldown into the Account Service workspace. We want to create an availability SLO that uses the results of AWS CloudWatch Canary. A Canary is a synthetic transaction, so this won’t be measuring real user experience. While that’s okay for availability, we might want to use real user data for response time and error SLOs.
After plugging SquaredUp into AWS CloudWatch, we’re ready to use CloudWatch data to determine an availability SLI for this service.
A good place to start is see the data we’re working with. Let’s start by dashboarding the following metrics from our canary:
- 2xx – Success responses
- 4xx – Not found responses
- 5xx – Internal error responses

What’s a good measure of availability using these metrics? For the synthetic transaction let’s categorize a 4xx as an error, so our SLI would be:
SLI = Canary success rate = 2xx / (4xx + 5xx)
And our SLO would measure this SLI over a time period and set a target, for example:
Canary success rate over 30 days > 99.9%
Let’s calculate the SLO in SquaredUp. For this we’ll use analytics mode, which allows us to run an in-memory SQL query against the CloudWatch to shape the data into what we need.

You can see the that our SLI over the rolling 30 days is 99.46%, which falls short of our objective of 99.9%.
It would be nice to add the target so that we can see this as an ‘error’. To add monitoring, switch to the monitoring tab and enter our target value. In this case the target is 99.99%. We can also add a warning that triggers at 99.995%. (A later blog will discuss how we can translate these percentages into error budgets that are easier to understand.)

The result is that we now have a dashboard showing our SLI and the SLO status:

Rolling up SLOs
Our management team wants to see a summary of SLOs across all of our microservices, without getting into the nitty-gritty details of AWS metrics. For this we need to publish the SLO as a KPI. We use the term KPI (Key Performance Indicator) in the SquaredUp because this feature isn’t limited to SLOs, we can take the same approach for other KPIs such as cost, DORA metrics and project status.
To publish as a KPI, we simply edit the SLO tile and select ‘Availability % (rolling 30 days)’. KPIs are configurable, so you can standardize on any measure or terminology that works in your specific context.

Lastly, let’s show how we can configure a top-level dashboard. For this we create a new workspace called Swag Store where we can report across the whole application.
Using the regular dashboard editor, we can create a tile that shows the availability SLO for all microservices. Here’s the end result:

This blog was a short walkthrough of calculating SLOs using SquaredUp and publishing them into dashboards. We used AWS CloudWatch data for a microservice application, but the great thing about SquaredUp is the flexibility – you can calculate SLOs using data from any tool.
If you’d like to see how SquaredUp can work for your environment, get started today for free with our out-of-the-box dashboards that will have you up and running in minutes.
Or, to learn more:
- Browse our plugin gallery of 50+ plugins
- Explore our key features
Thanks for reading!
Continue learning
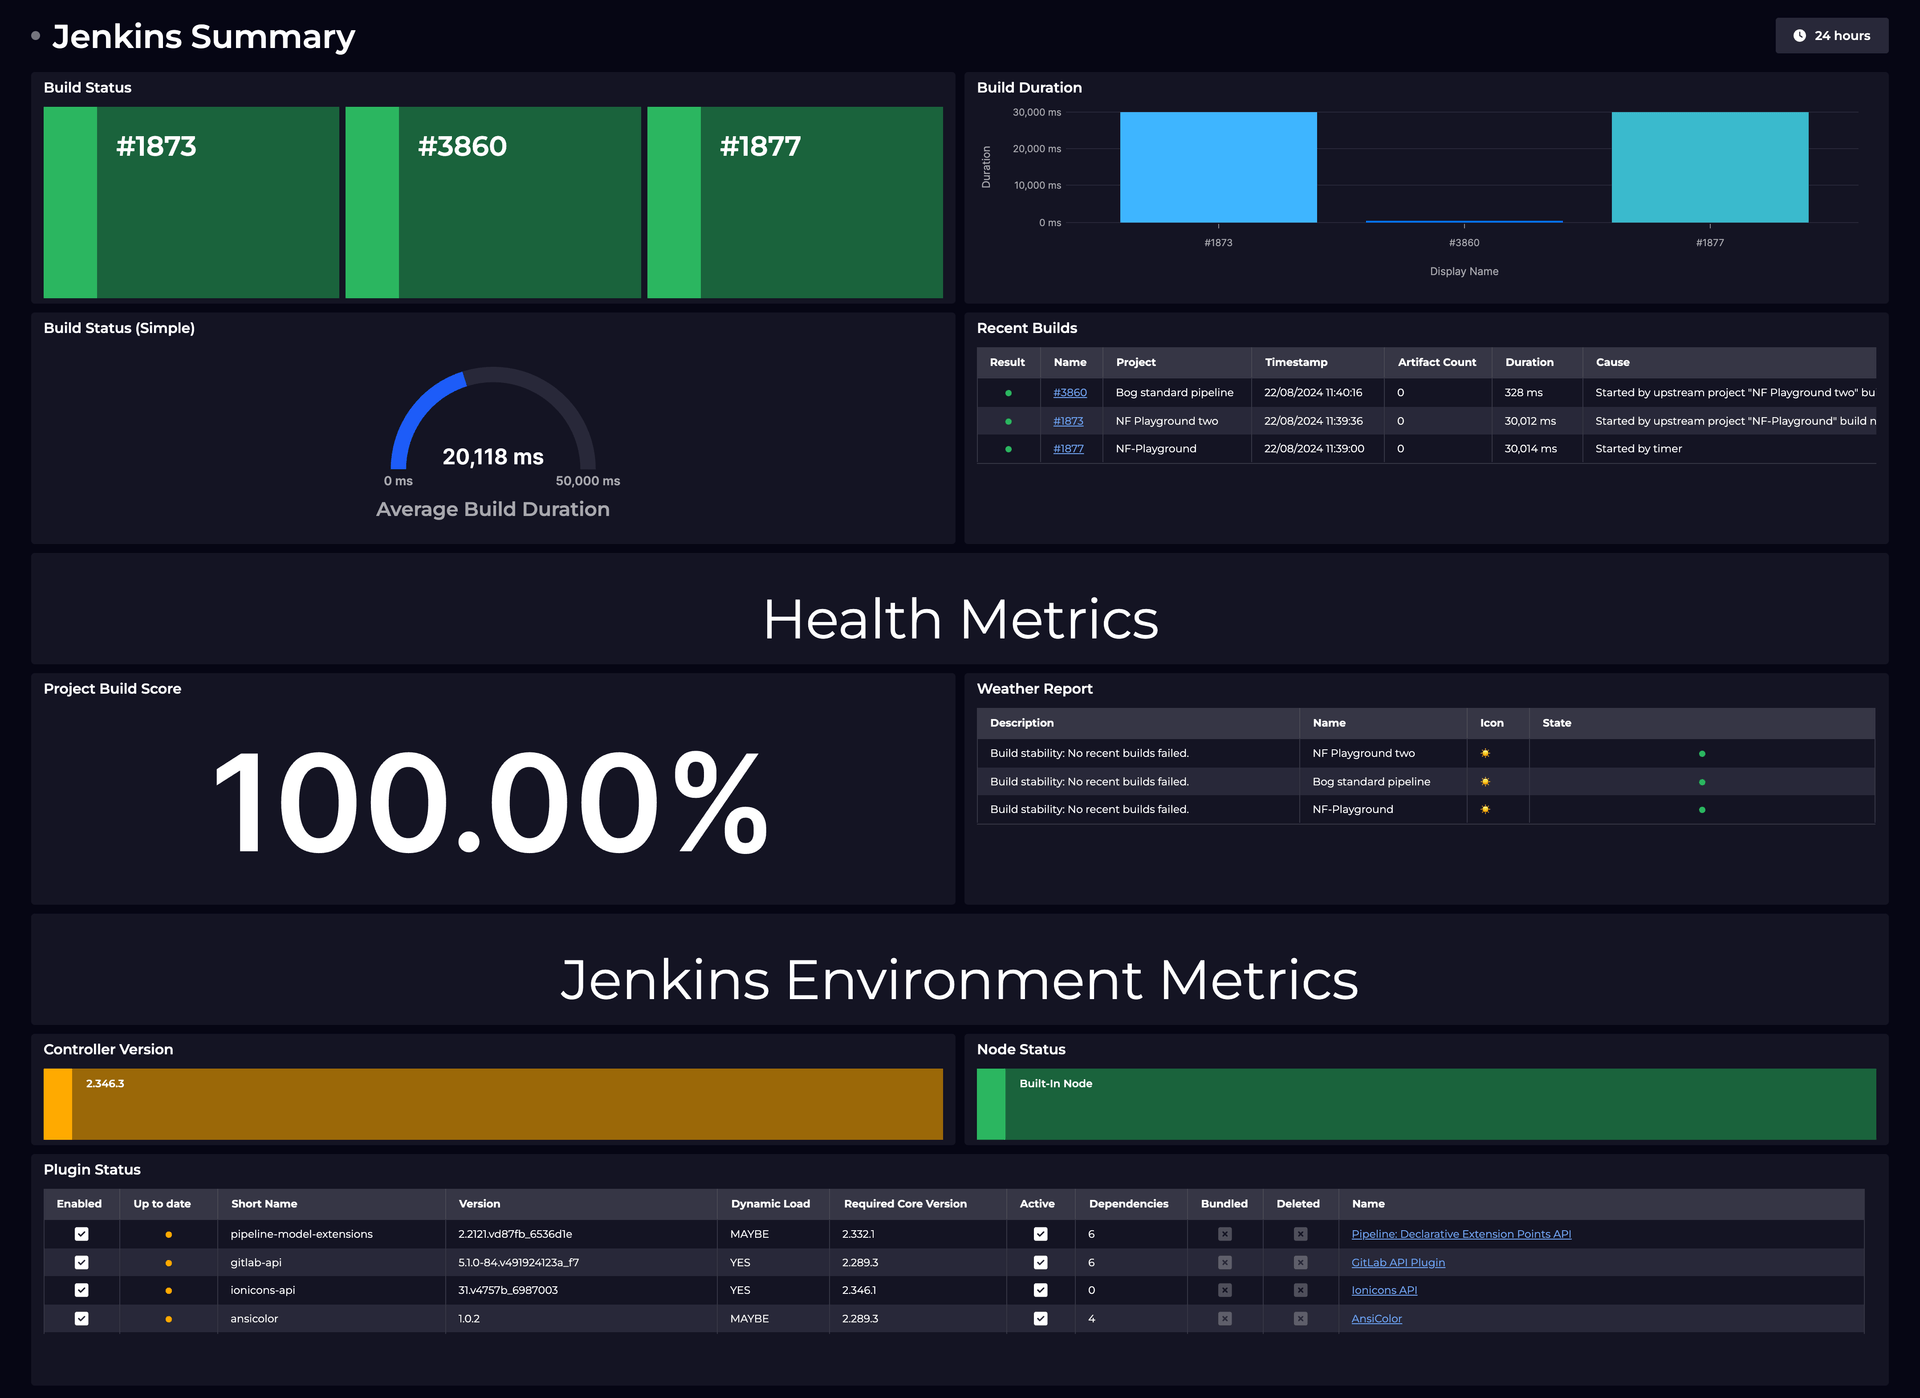
Dashboard Story
Monitoring Jenkins build status and performance

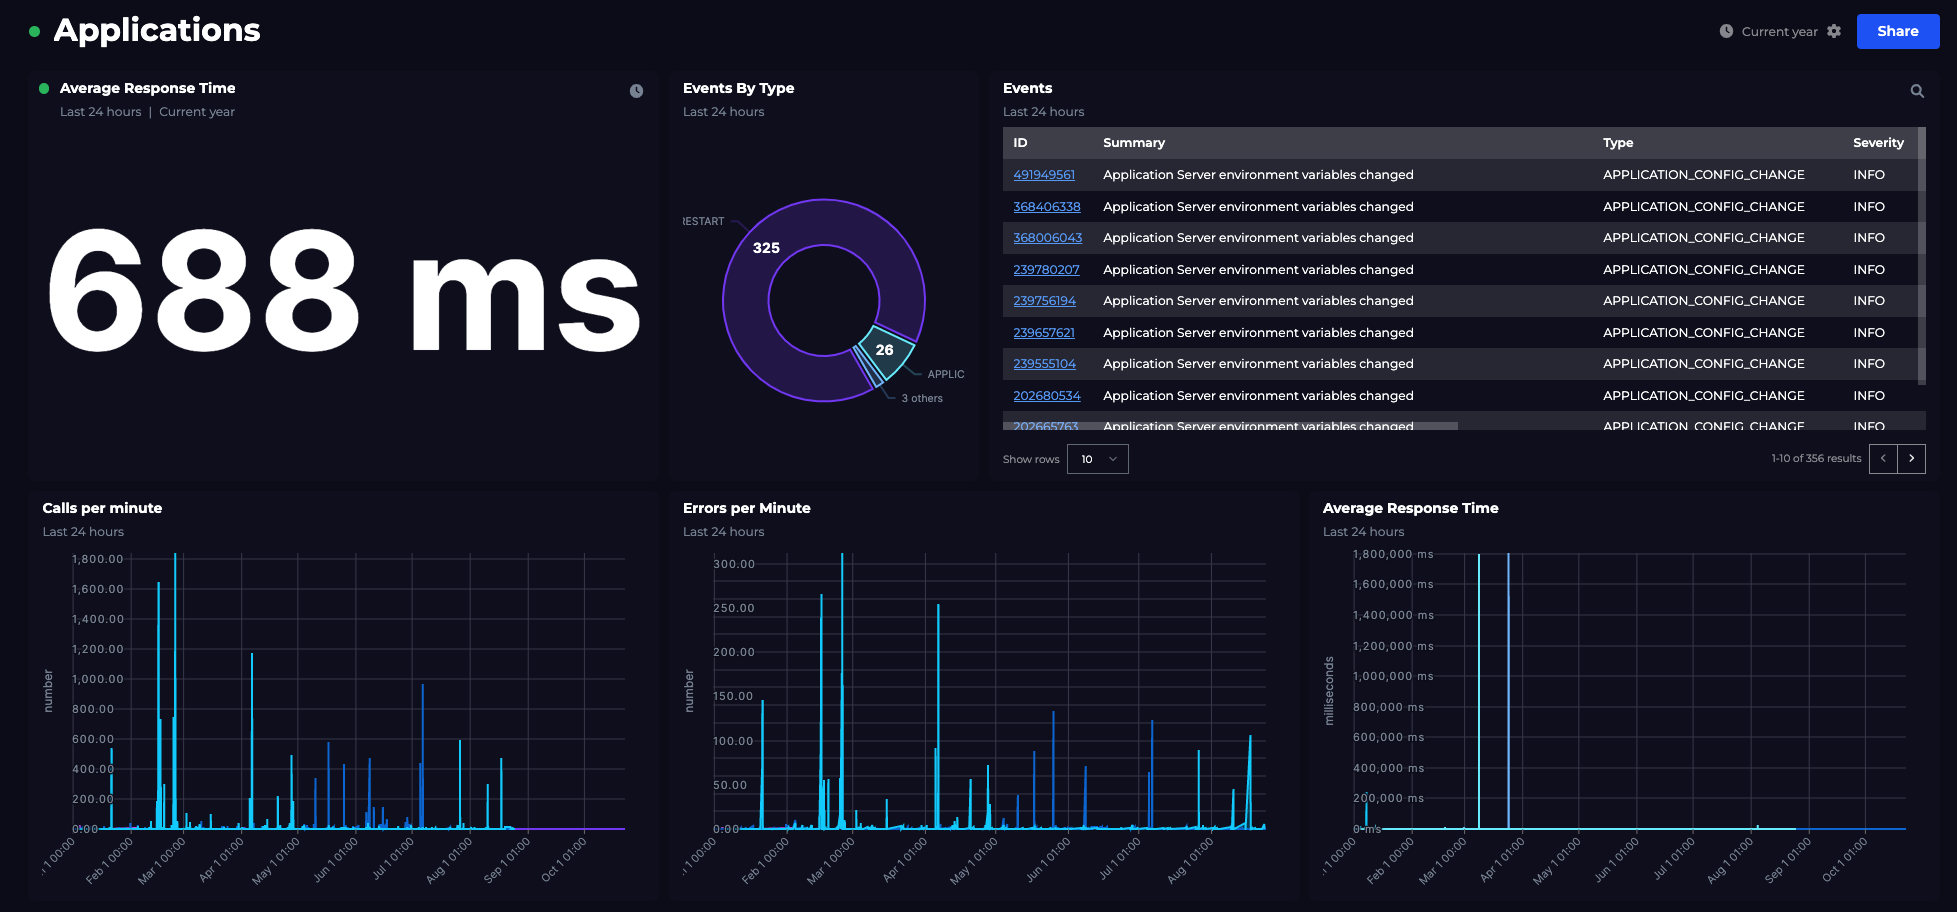
Dashboard Story
Monitoring AWS Lambda key performance metrics

Dashboard Story
Monitoring Azure OpenAI key performance metrics
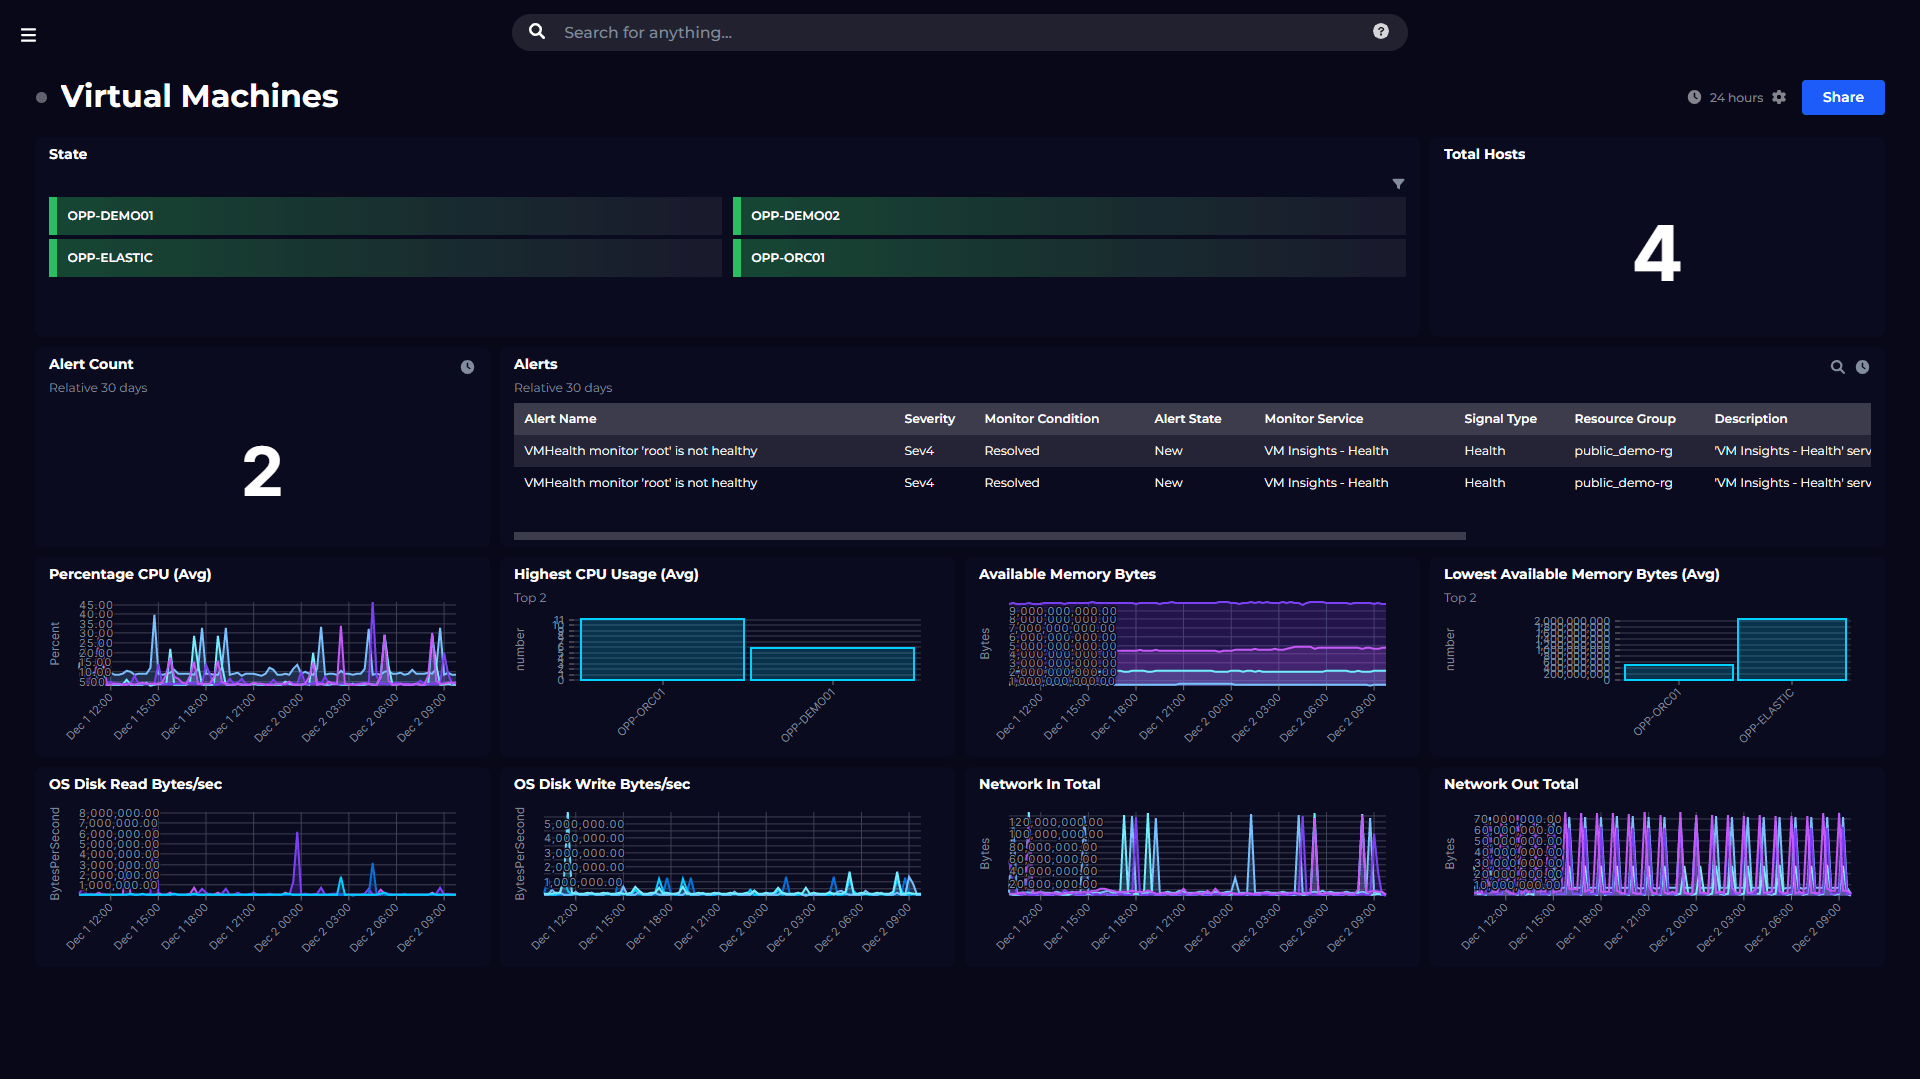
Dashboard Story
Monitoring performance of Azure VMs and Functions

Dashboard Story
End-to-end VMware health and performance dashboards
Dashboard Story
