John Hayes
Observability Advocate, SquaredUp
SQL is just for querying relational data, right? Well, not necessarily! With our SQL Analytics feature, you can run SQL queries over all types of data from all kinds of backend stores. This gives you incredible flexibility and power – you can even combine different types of entity (e.g. a pull request and a pipeline run) in a single query. Equally, I could have datasets with job tickets from Jira, ServiceNow and Zendesk and combine them in a single query.
The SquaredUp SQL Analytics database engine has now been migrated to DuckDB, which means better performance as well as a much more familiar dialect of SQL. We have had this feature in beta for some time, with some fantastic customer feedback, now we’re releasing the full version.
We have also made some major improvements to the user experience, with new features such as auto-complete and syntax highlighting. In order to really appreciate the power of SQL Analytics, you really need to see it in action. So let’s dive in!
In other tools, combining data from different vendors can mean complex programming or scripting. With SquaredUp SQL Analytics, it can be accomplished with a simple query like the one below:
SELECT "ResultsByTime.Groups.Metrics.cost.Amount" as Total FROM AwsCosts
UNION SELECT cost as Total FROM AzureCosts
This is possible because of the way that SquaredUp connects to data sources. Our plugins index the objects in your environment and organise them into a graph that understands the object type and its relationships.
With SQL analytics we can combine datasets from different plugins so that we can get global summaries across multiple dimensions. For example, we could aggregate the costs of our development and production subscriptions in Azure. In this article, we are going to look at how SQL Analytics makes it simple to aggregate costs across our cloud accounts.
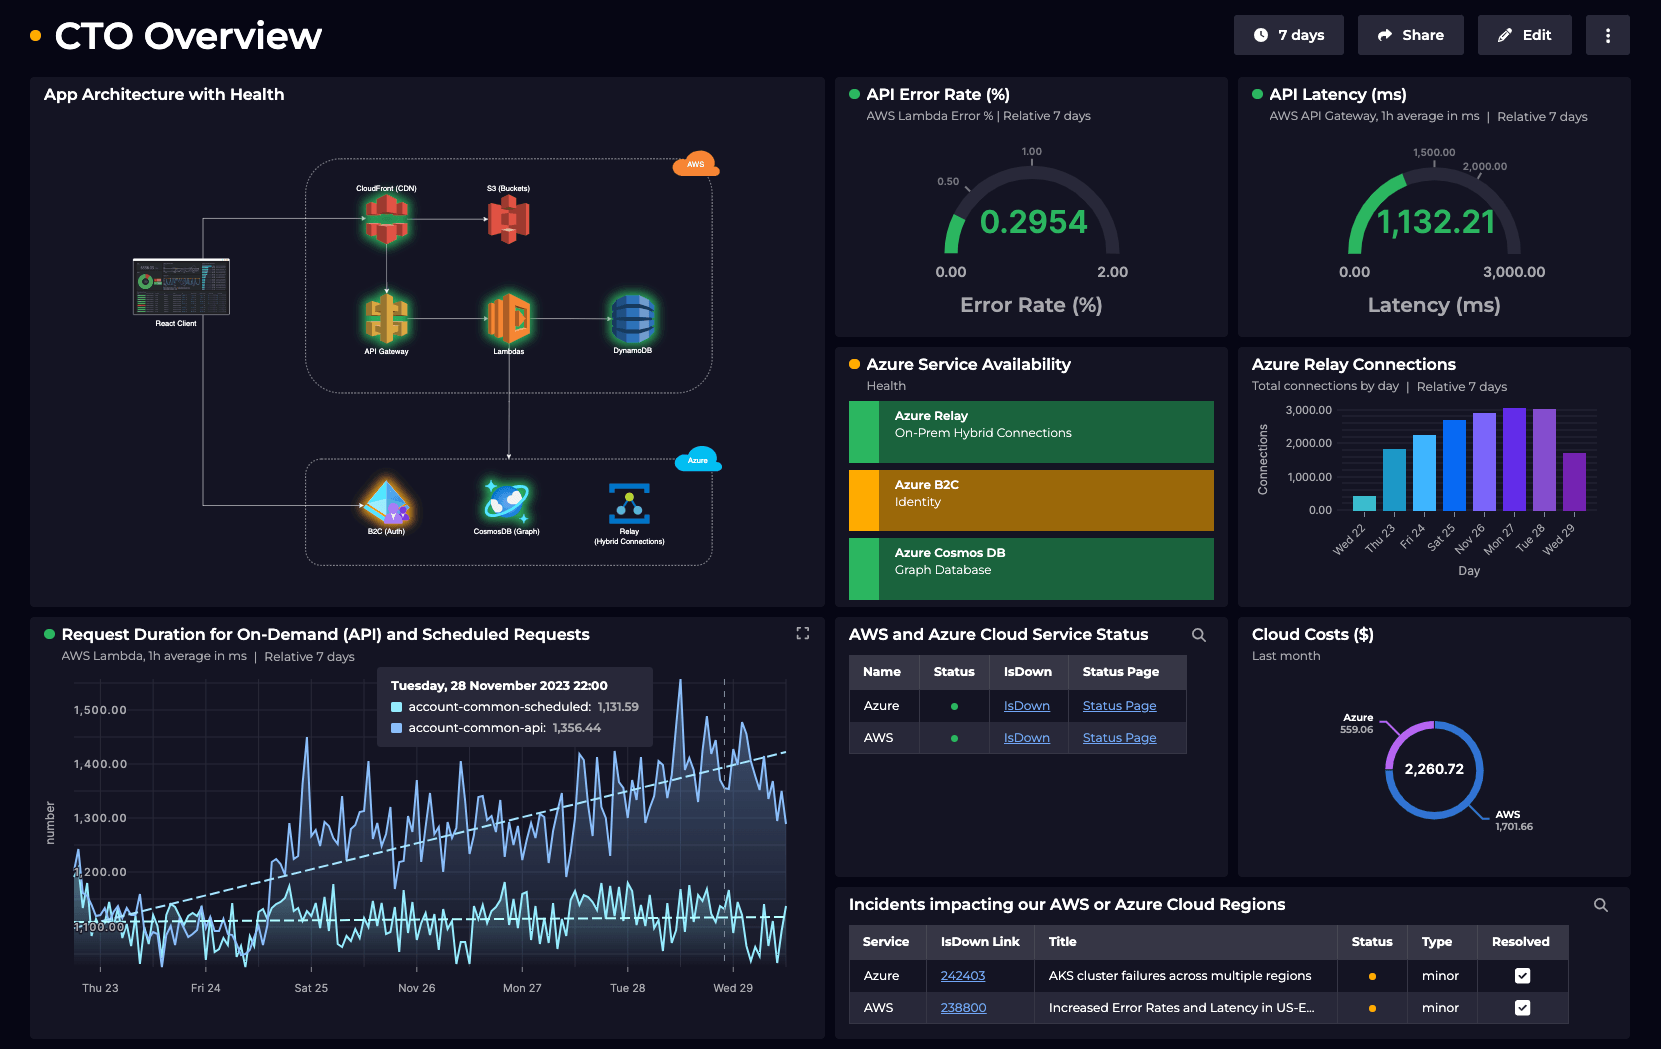
Below, we have a dashboard which uses the SquaredUp AWS and Azure plugins to connect to a number of cloud accounts. For each of the cloud providers we have added a tile displaying their costs.

We are now going to use SQL analytics to create a combined total cost. To do this, we can add a new tile and select the AWS Plugin and the Cost (Global) data stream:
Then select the accounts we want to report on:

Next we are going to turn on SQL Analytics for this dashboard tile:

When we do this, you will see that the data we have selected is captured as a dataset. We also now have a query editor with a default SQL statement. We are now going to click on the Add dataset button so that we can generate a dataset for Azure cost data

We will now be prompted to select a data stream. From the Data Source drop down list, select the Azure data source. Now we can select the Azure Cost data stream:

Next we select our scope. We are going to enable Dynamic selection and select all of our Resource Groups:

We now have two datasets with the default names of ‘dataset1’ and 'dataset2'. Let's rename them AwsCosts and AzureCosts respectively. Next we can just click on the SQL button to create our query:
The SQL Editor has intellisense and will prompt you to convert the display name for a field into its fully-qualified name.

Once you accept the prompt, the full SQL will be inserted:

Now we will create a UNION query with a SUM function to combine costs totals from the two tables. Our full query will be:
SELECT SUM(Total) as CombinedTotal FROM
(SELECT "ResultsByTime.Groups.Metrics.cost.Amount" as Total FROM AwsCosts
UNION SELECT cost as Total FROM AzureCosts)
In a way, this almost seems magical. We are using pure SQL to summarise data from two completely different APIs with completely different data structures. You don’t need to be familiar with Azure Kusto or Amazon Athena – you can query all of your resources as if they were SQL tables. As you can see in the image below, the query editor also has syntax checking in case any typos creep into your SQL:

To display the data, we will select the Scalar visualization and then format the column as a Currency type, rounded up to two decimal places:

And now we have a single tile displaying our overall cloud costs:

Having this capability is tremendously exciting. It gives us the potential for combining datasets from heterogeneous data sources and aggregating, summarizing and comparing data in all kinds of ways. The intellisense, syntax highlighting and closer alignment with standard SQL provide a truly first-class experience for analyzing your enterprise data.
Try the new SQL Analytics today and see what new possibilities you can open up! If you don't have a SquaredUp account, you can sign up for our Free Forever plan and be dashboarding within minutes.
Observability Advocate, SquaredUp


Getting started with SquaredUp is free and easy. Our free tier includes: