Louise Berry
SquaredUp
What is it that makes a high-performing software engineering team successful? This was the challenge undertaken by the DevOps Research and Assessment (DORA) team around 2015, who created a set of metrics that could provide a reliable, data-driven way to measure and improve software delivery performance.
The team’s aim was to reduce developer pain by removing friction from deployment processes, by answering one question: What practices and capabilities enable teams to deliver software quickly and reliably while achieving business goals?
The group identified four key indicators inherent in high-performing teams, and thus, DORA metrics were born and quickly embraced as meaningful measures in DevOps and engineering teams the world over.
While the metrics are commonly used, their true value lies in how teams interpret and act on them to drive meaningful improvements (we talk about the right way to use DORA metrics here). Choosing the right reporting tool can make all the difference in how actionable and accessible these insights are for your team.
In this blog, we’ll compare three leading options: SquaredUp, Power BI, and Jira, to assess the best fit for your requirements.
A quick summary of the findings:
SquaredUp provides intuitive, real-time DORA metrics dashboards with seamless integration to DevOps tools, making it easy for teams to visualize and act on their software delivery performance.
Power BI offers highly customizable DORA metrics reporting through advanced analytics and visualizations, but typically requires manual setup and data modeling to connect with DevOps data sources.
Jira enables tracking of DORA metrics by integrating with development and CI/CD tools, offering basic insights natively but with limited depth and customization compared to dedicated analytics platforms.
Before we explore the various tools used for this kind of reporting, let’s just have a quick reminder of what DORA metrics are, and why they are so valuable.
DORA metrics consist of:
These four are essential for measuring DevOps performance and driving continuous improvement. But should you be tracking DORA metrics? Here is a brief explanation of why you should:
Objective measurement: DORA metrics offer a standardized, quantifiable way to assess how well DevOps practices are working, making it easier to identify strengths and areas for improvement.
Enhanced visibility: They provide transparency into the software development lifecycle, showing how code moves from development to production and how quickly issues are resolved.
Data-driven decisions: By tracking these metrics, organizations can make informed decisions based on real data rather than intuition, leading to more effective process improvements.
Continuous improvement: Teams can use DORA metrics to set goals, measure progress, and drive ongoing enhancements in delivery speed, quality, and reliability.
Alignment with business goals: DORA metrics help align IT and business objectives, ensuring that software delivery efforts contribute directly to customer satisfaction, revenue growth, and competitiveness.
Benchmarking and standardization: They enable teams to compare performance internally and against industry standards, promoting best practices and healthy competition.
For a more in-depth analysis on DORA metrics, we expand more on the topic in this blog.
Now, on to the tools...
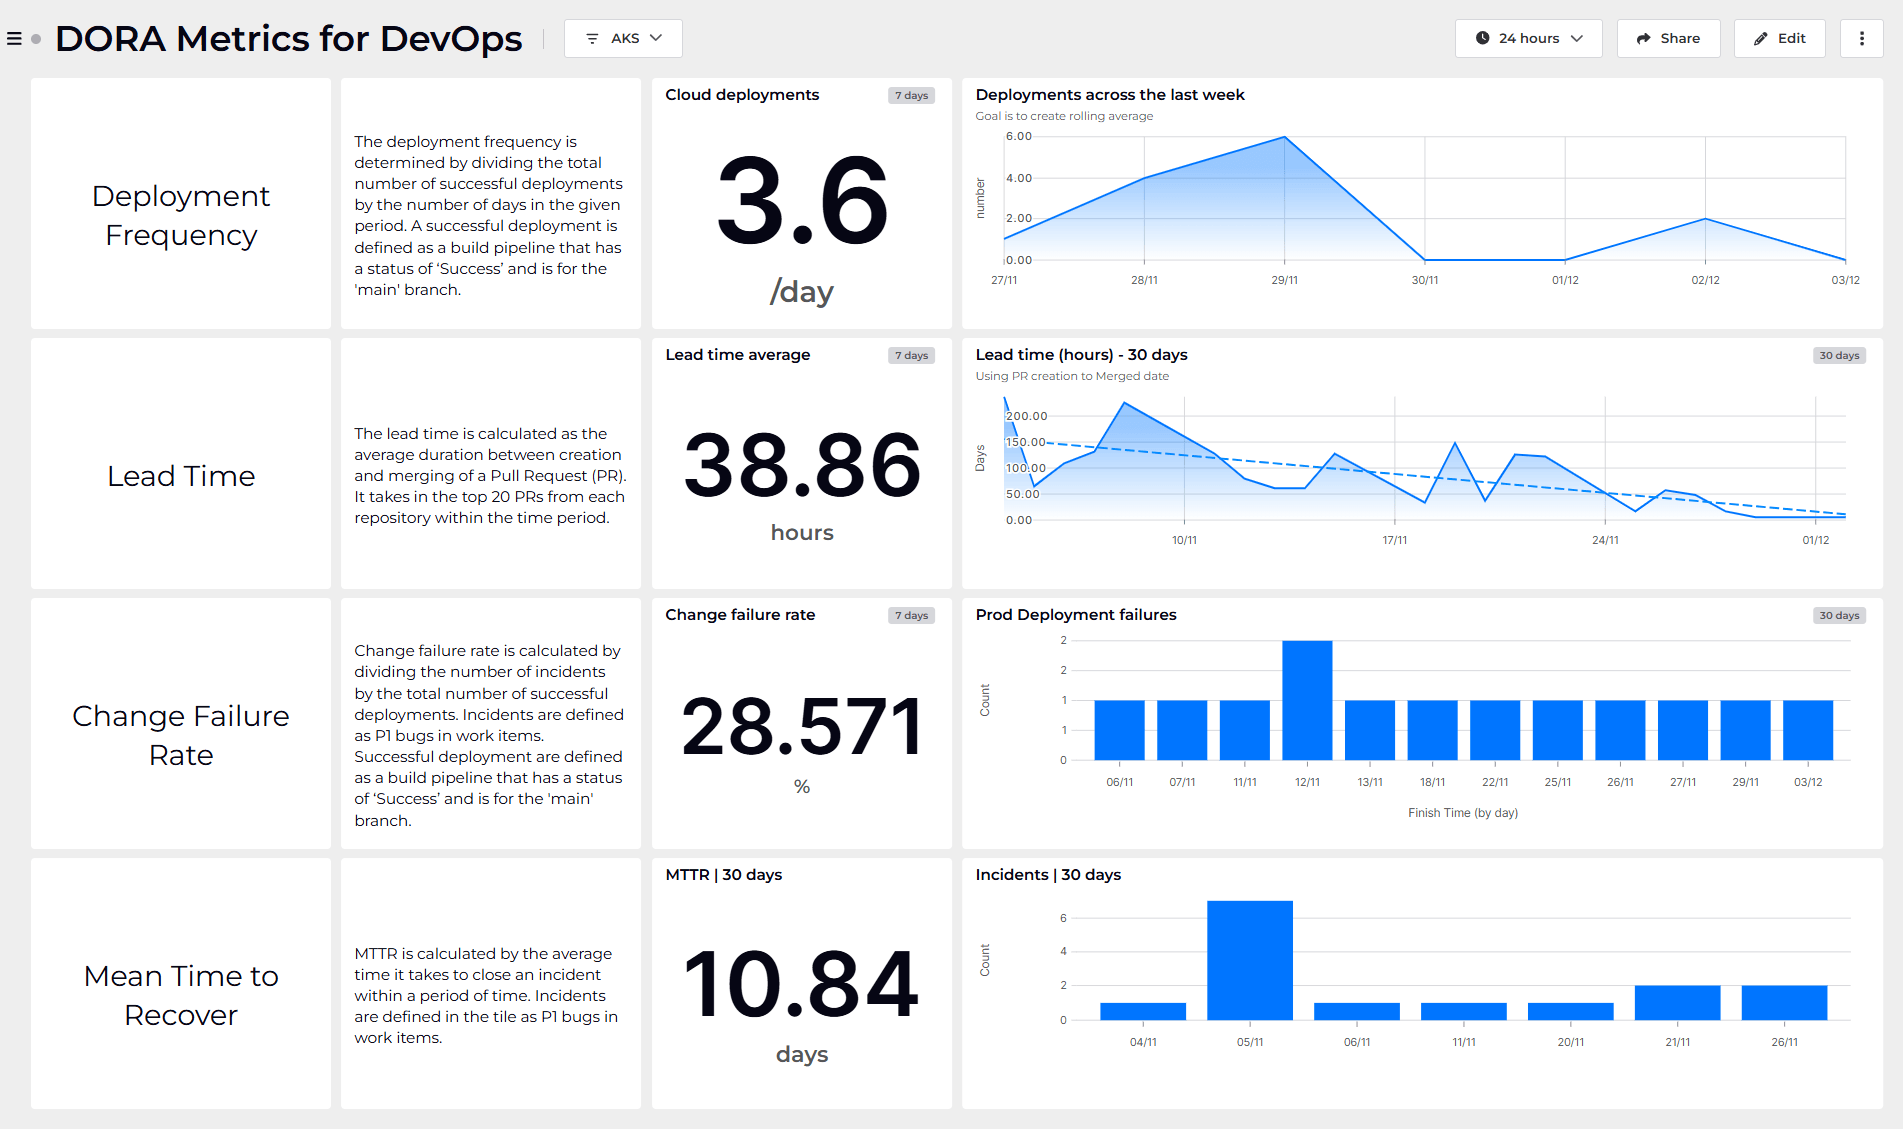
SquaredUp is designed for teams that need powerful, real-time dashboards without the complexity of traditional BI tools. It connects directly to a wide range of data sources (including Azure DevOps and other DevOps tools), enabling unified, always up-to-date DORA metrics dashboards.
Key features include:
Ease of setup: Direct, code-free integration with DevOps tools - no complex ETL or data warehouse required. You can find out more on creating a SquaredUp DORA metrics dashboard here.
Real-time data: Dashboards update instantly, ensuring you’re always seeing the latest performance metrics.
Cross-project visibility: Out-of-the-box support for aggregating data across multiple projects and tools.
User experience: Intuitive dashboard creation, drag-and-drop functionality, and rich visualizations make insights accessible for both technical and non-technical stakeholders.
Unified analytics: Ability to combine and correlate data from multiple sources for holistic reporting.
Contextual adaptation required: Like all DORA dashboards, SquaredUp’s reporting is only as meaningful as the context you provide – DORA metrics alone don’t explain why trends occur, so teams must supplement dashboards with qualitative insights and adapt metrics to their unique workflows.
Framework boundaries: DORA metrics are a starting point, not a comprehensive solution. While SquaredUp makes it easy to visualize and extend metrics, teams still need to define what “success” looks like for their environment and avoid over-optimizing for numbers alone.
Dependent on data quality: The accuracy of SquaredUp’s dashboards depends on the quality and completeness of data in your connected DevOps tools.
Power BI is a robust business intelligence platform known for its advanced analytics and customizable visualizations. It’s highly flexible and integrates well with the Microsoft ecosystem, making it a popular choice for organizations already using Azure DevOps or other Microsoft tools.
Customization: Extensive options for building custom dashboards and reports.
Integration: Works with a wide variety of data sources, though setting up DevOps metrics often requires additional configuration and expertise.
Learning curve: More complex to set up and use, especially for teams without dedicated BI resources.
Data refresh: Dashboards are not always real-time and may depend on scheduled refreshes.
Complex setup: Building DORA metrics dashboards in Power BI often requires significant manual effort-data modeling, custom queries, and regular maintenance are needed to ensure accuracy and relevance.
Not DevOps-native: Power BI is a general-purpose analytics tool, so it lacks built-in DevOps context and may not easily support advanced DORA metrics without substantial configuration.
Delayed insights: Power BI dashboards typically rely on scheduled data refreshes, making real-time monitoring of DORA metrics more challenging compared to purpose-built tools.

Jira, especially when paired with Atlassian’s Open DevOps suite, offers native DORA metrics reporting for teams already using Jira for project management. It provides a familiar environment for tracking delivery performance within the context of your existing workflows.
Native integration: Seamless experience for teams already using Jira and Bitbucket.
Reporting: Built-in dashboards for DORA metrics, though customization and cross-tool visibility can be limited compared to dedicated analytics platforms.
Ease of use: Simple for basic reporting, but may require plugins or integrations for more advanced analytics.
Quantitative focus: Jira’s DORA reporting emphasizes operational metrics (like deployment frequency and failure rate), but may overlook qualitative factors such as code quality, user satisfaction, and team collaboration.
Limited adaptability: Not all teams or methodologies fit neatly into the DORA framework – Jira’s dashboards may not fully capture the nuances of your delivery process, especially for organizations with unique workflows or release cadences.
Surface-level insights: While Jira can display DORA metrics, it may not provide deep analysis or easy integration with non-Atlassian tools, limiting cross-platform visibility.
Feature | SquaredUp | Power BI | Jira |
|---|---|---|---|
| Ease of setup | User-friendly, fast integration with out-of-the-box DORA dashboards | Requires technical setup, data modeling, and connector configuration | Basic setup, but may require custom fields and integrations for full DORA coverage |
| Real-time data | Real-time, on-demand data visualization across multiple tools | Data refresh is scheduled, not always real-time | Near real-time if integrated with CI/CD, but limited by integration depth |
| Visualization quality | Rich, interactive, and visually engaging dashboards designed for DevOps metrics | Highly customizable and advanced visualizations, but requires expertise | Standard Jira dashboards; limited customization and visualization options |
| Cross-tool integration | Seamlessly unifies data from CI/CD, cloud, APM, and more with 50+ plugins | Can combine data from many sources, but often complex to configure | Primarily integrates with Atlassian and select CI/CD tools; limited broader integration |
| Customization & flexibility | Easily tailored dashboards with moderate to high flexibility | Extensive customization, ideal for advanced analytics, but with a steep learning curve | Limited flexibility; customization usually requires plugins or scripting |
| Learning curve | Low to moderate; designed for both technical and non-technical users | High; best suited for users with BI or data analysis experience | Low for basic use, but increases with advanced needs or integrations |
| Unified monitoring & analysis | Unified, real-time monitoring and analytics across all connected tools | Strong analytics but lacks unified, real-time monitoring across tools | Focuses on issue/project tracking, not unified analytics |
| Ideal for | Teams seeking easy, powerful, and actionable DORA insights without heavy technical overhead | Organizations needing deep, custom reporting and willing to invest in setup and maintenance | Teams already using Jira for project management needing basic DORA tracking |
Ultimately, all three tools – to various extents – can help track and visualize DORA metrics. But as we’ve seen, their strengths differ. Power BI is ideal for organizations with complex analytics needs and existing BI expertise and Jira is a good fit for teams deeply invested in the Atlassian ecosystem seeking native, straightforward reporting.
But it’s SquaredUp that stands out for its balance of power and simplicity-offering real-time, unified dashboards with minimal setup, making DORA metrics accessible to teams of any size without the steep learning curve or siloed data challenges of other platforms. For organizations seeking actionable DevOps insights with maximum efficiency, SquaredUp is a compelling choice.
SquaredUp’s smarter dashboards help engineering, product, and IT teams make better decisions through a deeper understanding of their data. We have a completely free tier available for you to use today. Sign up for free now!
SquaredUp


Getting started with SquaredUp is free and easy. Our free tier includes: