Dan Watts
DevRel Engineer, SquaredUp

Getting started with SquaredUp is free and easy. Our free tier includes:
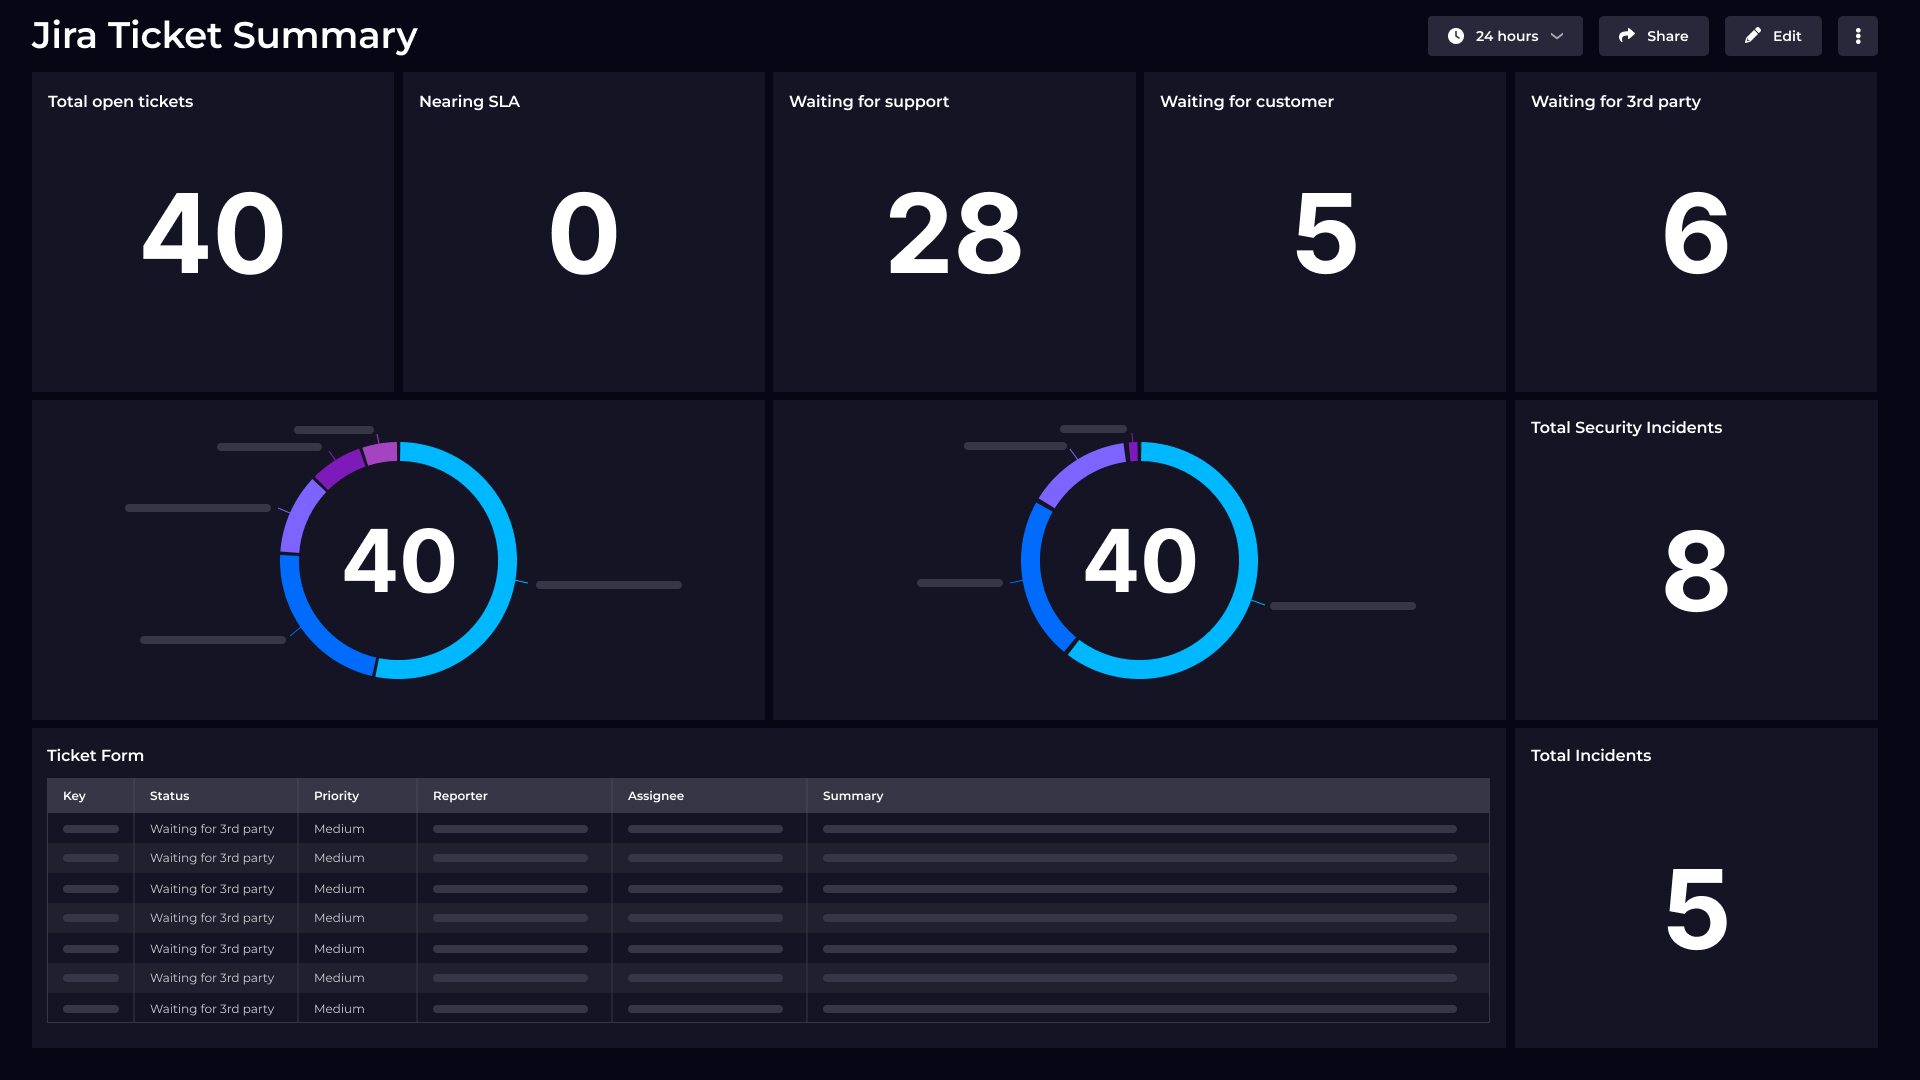
This dashboard integrates with our HaloPSA plugin to provide a view of ticket activity, improving visibility and response times.
DevRel Engineer, SquaredUp
Managing IT service tickets efficiently is critical for maintaining smooth operations. This SquaredUp dashboard integrates directly with HaloPSA using our dedicated HaloPSA plugin, providing comprehensive real-time visibility into your service management data.
The donut chart on the left visualizes the number of tickets raised by each company. In this example:
This chart helps identify which clients are consuming the most support resources, guiding resource allocation and proactive outreach.

The bar chart on the right breaks down ticket creation by user.
Use the Tickets data stream with grouping by Client Name field to achieve a similar result with your data
By identifying high-volume users, the support team can target training and system improvements to reduce repeat issues.

The table at the bottom provides a detailed breakdown of all tickets, including:
The HaloPSA plugin provides rich user data through fields like userEmail and custom user identification, making it easy to aggregate tickets by the requesting user.
The table allows support teams to drill down into specific tickets, spot patterns, and ensure high-priority issues are addressed promptly.

Increased visibility: Teams can spot high-ticket volumes and allocate resources accordingly.
Faster resolution: Prioritizing tickets based on urgency and SLA improves response times.
Proactive support: Identifying high-need companies and users allows for targeted training and system improvements.
This dashboard centralizes ticket management, combining high-level trends with actionable detail. The ability to see which companies and users generate the most tickets – and why – empowers support teams to make data-driven decisions, resolve issues faster, and improve service quality.
The HaloPSA plugin provides a simple yet powerful integration that scales with your organization's needs. By leveraging SquaredUp's purpose-built HaloPSA integration, teams can focus on what matters most: delivering exceptional customer support.

By SquaredUp
Visualize and monitor HaloPSA tickets, assets, clients, and reports to track key metrics, trends, and ticket status in real-time