Tim Wheeler
Director of Engineering Excellence, SquaredUp

Getting started with SquaredUp is free and easy. Our free tier includes:
These SquaredUp dashboards uses the Azure DevOps plugin to let you monitor the status of your CI/CD automation, monitor Azure DevOps for failures and large queues, track the usage of your agents and resources, and summarize work items and test cases.
Director of Engineering Excellence, SquaredUp
Azure DevOps (ADO) is a feature rich and powerful tool for CI/CD, testing and work management. However, the native Azure DevOps dashboards are very limited and limit the scope of what you can visualize and how you can display it. For example, there is no way to bring together metrics across projects on one page. You also do not have the ability to aggregate metrics and monitor metrics so you can be proactive in managing DevOps in your organization.
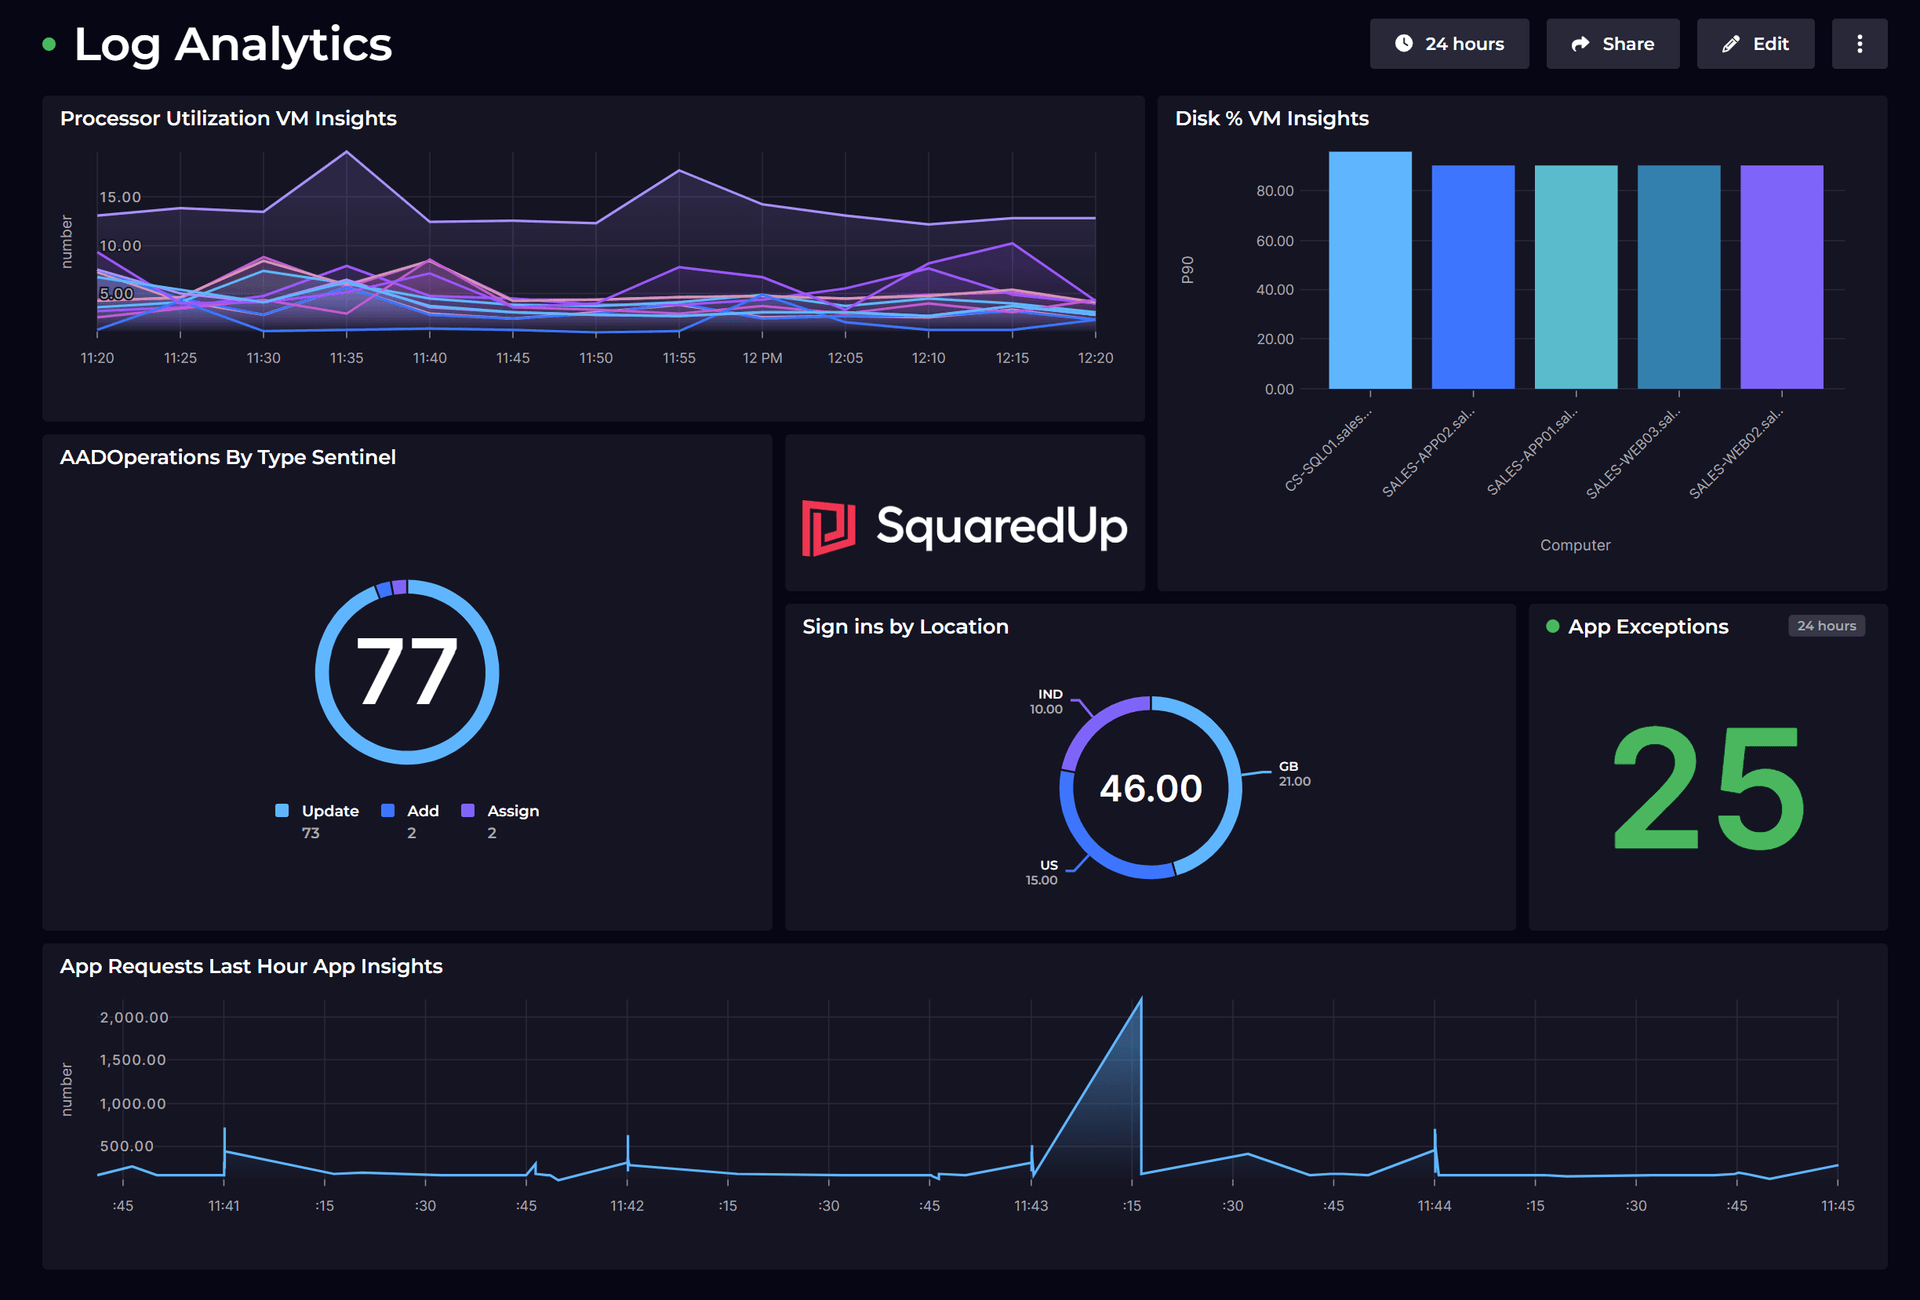
You can build powerful Azure DevOps dashboards in SquaredUp using the Azure DevOps plugin to combine data across your whole organization and visualize these in a single tile or dashboard. You can bring in data from your pipelines, releases, work items, test cases, artifacts, agents, deployment pools, resources, and repos. SquaredUp also has out-of-the-box data streams that will let you focus in on pipeline failures and agent usage in a couple of clicks.
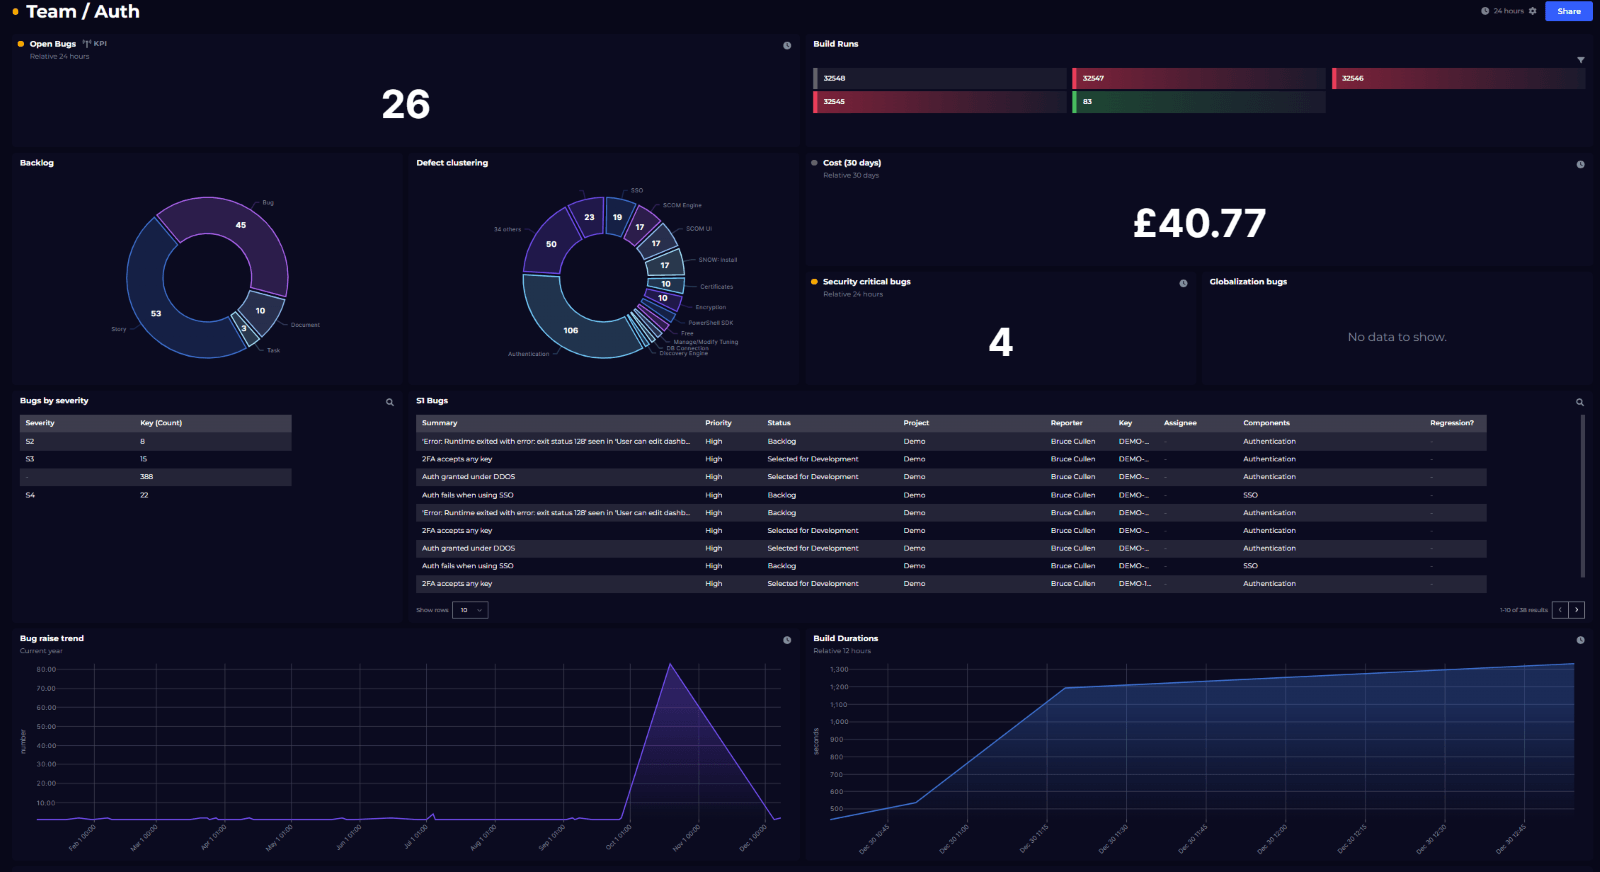
By combining data from across several pipelines and projects, you get the complete picture of the state of your CI/CD processes at a glance. You can quickly highlight failures or slow pipelines that are impacting your business. You can also monitor these tiles and get notified when they break the thresholds that you set.
SquaredUp Azure DevOps dashboards allow you to split the data across projects, products, or even down to microservices. You will quickly be able to create several dashboards tailored to the needs of different teams. For instance, if you have several microservices for a single product that deploy regularly to production, you can see the state of those pipelines in one tile. You can easily and quickly investigate how efficient you are being with your resources by displaying agent usage and job queues.
To set up an Azure DevOps dashboard in SquaredUp, all you need is the ADO plugin and your organization name and a personal access token from Azure DevOps. Then, you can start building your dashboard. In fact, as soon as you've connected to the plugin, the five out-of-the-box ADO dashboards in SquaredUp will be automatically populated. Plus, you can build custom dashboards to suit your teams.
These out-of-the-box Azure DevOps dashboards that can be used as the basis for creating your own tailored versions. These will automatically pull in your live data once you're connected to the plugin.
1. Overview Azure DevOps dashboard
This overview dashboard surfaces nearly every object type that you can get in Azure DevOps.
2. My DevOps Organization
This is a high-level view of your DevOps organization with oversight of projects, pull requests, artifact packages, task and deployment groups, and more.
3. Pipeline: simple overview
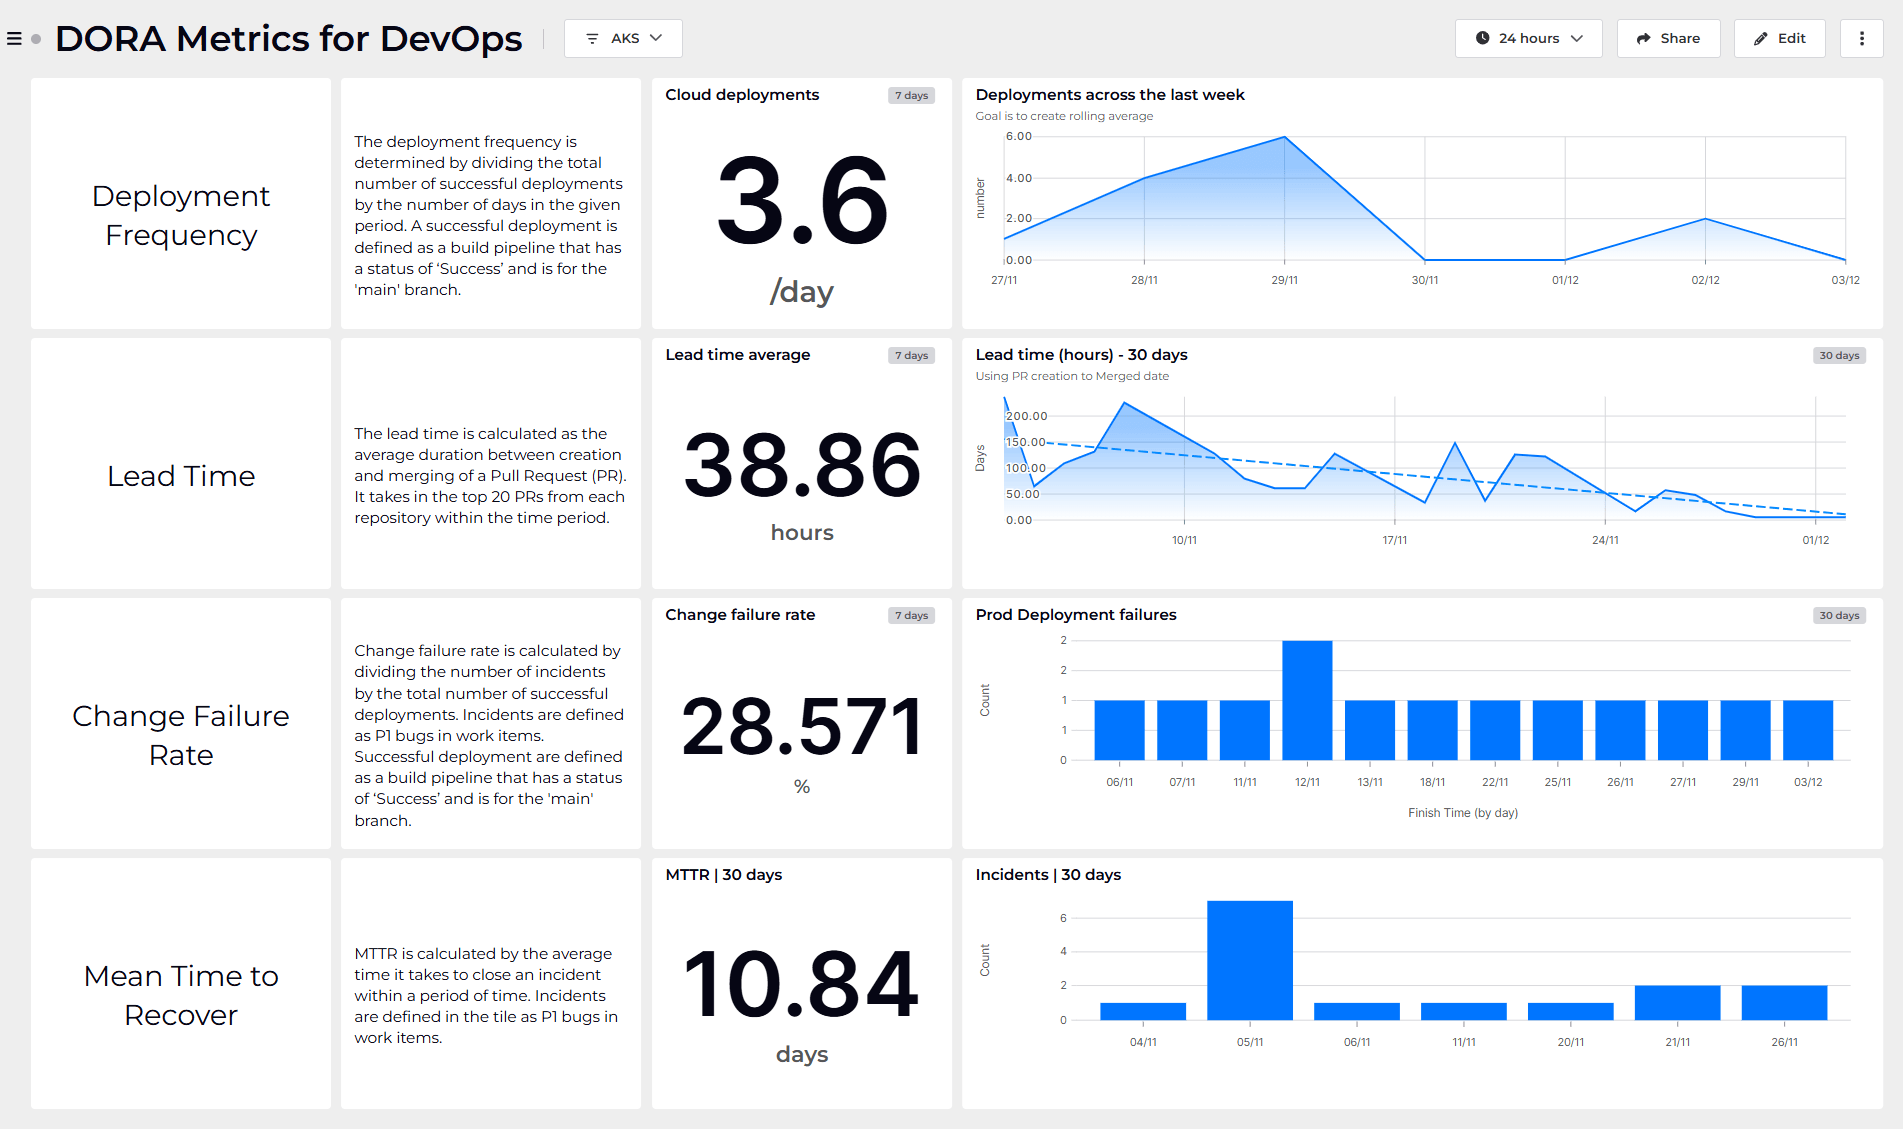
If you rely on ADO for running pipelines and want to see their aggregated metrics, this simple overview dashboard shows top-line build, deployment and release metrics.

4. Pipeline overview
In addition to build metrics such as failures, runs and health, the Pipeline Overview dashboard surfaces more granular pipeline data including job queues and agent usage to improve efficiency with right-sizing.
5. Single build pipeline
This dashboard is much like the pipeline overview dashboard, but is intended to shine a light on a single, specific build pipeline of your choice.
It will initially use data from the first pipeline it can find from your environment, but this can be easily customized by editing the tiles and selecting a specific pipeline from the Objects section.

All of these dashboards will be available to you out of the box once you connect to the Azure DevOps data source, so you can expect to be up and running in minutes.
To see what other dashboards you can create, check out our Dashboard Gallery. You can also browse these real-life Azure DevOps dashboard examples to see how we use them internally at SquaredUp.