Nathan Foreman
Principal Software Engineer
In the realm of data and complex scenarios, we humans naturally gravitate towards visualizing things as entities with attributes, rather than just raw data. Consider the phrase, “The response time on our Ad Generation service has increased.” It immediately resonates with the audience supporting the service. In contrast, saying, “Metrics that have the service tag of ‘Ad Generation’ and the type of ‘response time’ are showing values higher than last week,” sounds unnecessarily complicated.

Prometheus’ data storage, however, requires those querying the data to know what labels to search across and what values to expect in those labels. While this might be manageable for developers, it can become a challenge for support and management teams. They may know they’re looking for ‘Ad Generation’, but will they know if it’s a Service, Product, Function, or Business Process?

If you had the chance to catch Richard Benwell’s talk Connecting the dots with OTel semantic conventions at Monitorama this year, you'd know how OTel is changing the game. If not, I highly recommend watching the recording. Here's a simplified version of the key points.
Open Telemetry sets out standards for logs, metrics, and span data, aiming to create a ubiquitous standard that can be used across tools and platforms. The semantic conventions portion specifically looks at how the resources these items talk about are referenced. It provides guidance on what the attributes and label names should be, as well as what the values should be and their format.
So, we're all using the same names now. What's next? This is where I've been using OTel’s specifications to perform some inference and create objects from the labels on Prometheus’ time series data. Let's break down the difference between using raw data and some nice OTel naming.
‘service.name’ = Ad Generation
Using the standard name of ‘service.name’ (or service_name in Prometheus), we can infer that your environment has a service named ‘Ad Generation’ that spans across multiple signals. This allows us to create a service-typed object in our catalogue and start to track what metrics are available for this service.
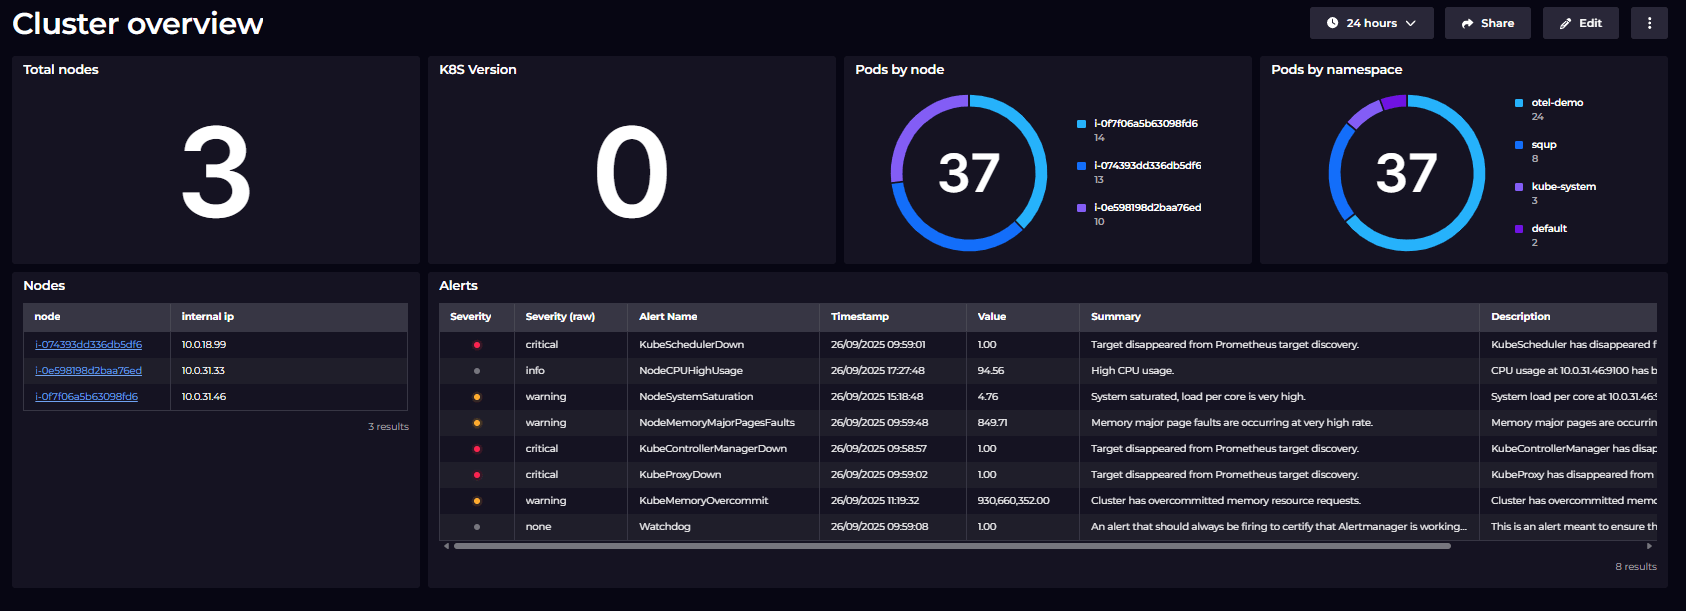
‘K8s.pod.name’ and ‘k8s.node.name’
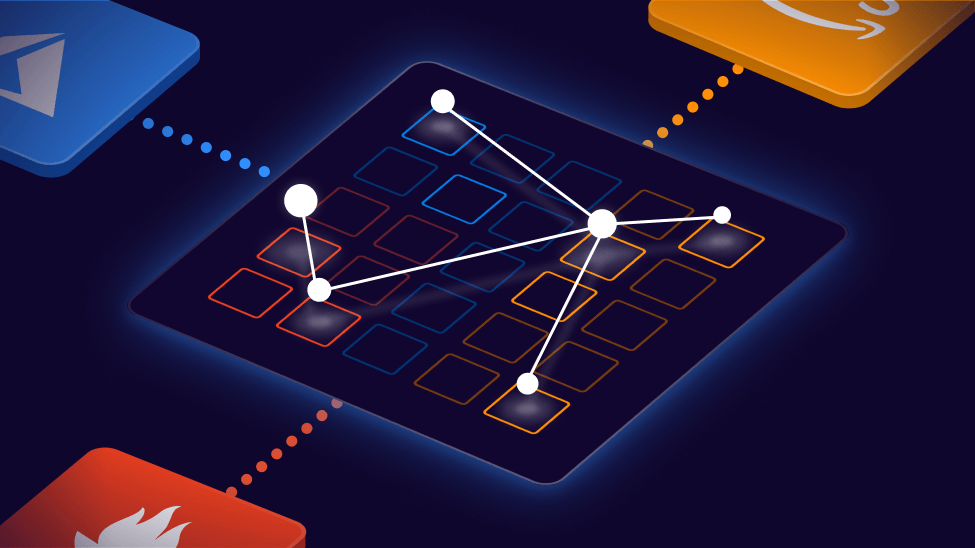
If your metrics also report the Kubernetes assets they run on when they get sent into Prometheus, we can start to get a small picture of the instrumented environment. We've got nodes and pods that are running, and we can connect them together based on where we see the tags overlap. Include this with our ‘service.name’ tagging, and we've now got a picture of what Pods a Service depends on, and what Nodes those Pods run on.

Richard's talk underscores the significance of OTel conventions in consolidating data from disparate systems, a principle that truly shines when applied to real-world scenarios. Let's consider an example where we're using AWS to host our Kubernetes cluster.
The AWS resources for Kubernetes and EC2 can be enriched with OTel semantic properties derived from existing resource data. By employing these standardized names, we can establish a comprehensive network of connections. For instance, we can link an EC2 instance running a Kubernetes node to the Service it provides, complete with health and status data from both systems.
The beauty of this approach lies in its ability to create a seamless data tapestry. The inferred objects from Prometheus and those from the AWS API can be woven together effortlessly, thanks to the consistency of OTel conventions. This results in a unified, coherent view of your system, enhancing your understanding and management of your IT environment.
Attaching AWS resources to the Prometheus data they’ve generated is a great start, but it's just the beginning. As more and more systems start to use these standardized names, our interconnected data points will grow seamlessly.
If this data were stored in a graph database, for example, we could use Gremlin queries (a topic for another day) to "Create a group with all objects that are related to this service, and required for it to run". This group now dynamically changes as the environment changes, the relationships are updated, and the objects in the group move in and out to keep your picture referencing and showing an accurate copy of your live environment.
If you've used OTel in your projects, the community would love to hear about your experiences. Your insights and stories can greatly benefit others who are on the same path. Share your experiences in the comments below, or reach out on LinkedIn or other social platforms.
As for me, I'll continue to delve deeper into the world of OTel and Prometheus, exploring new ways to optimize and join data in SquaredUp. I invite you to join me on this journey. Let's learn, share, and grow together in this exciting field. To read about how I used Prometheus and OTel to consolidate data and give it context, check out my latest blog.
Learn more about SquaredUp's unique approach to connecting data here.
Principal Software Engineer

Getting started with SquaredUp is free and easy. Our free tier includes: