
 Data Mesh
Unified visibility:
a data mesh approach
Is it possible to bring together data from across the entire engineering stack, without sinking time, effort and money into creating just another data silo? It is with data mesh.
Why so many tools?
Developing and running complex software applications requires a comprehensive understanding of what is happening – not just for troubleshooting when things go wrong, but making sure everything is going right.
To get visibility, IT and engineering organizations invest in monitoring and observability tools. But not just one. Different technology teams adopt specialist tools: SIEM platforms for security logging, IT monitoring tools for server infrastructure, open-source observability databases for container monitoring, and built-in cloud monitoring for serverless and PaaS.
Beyond monitoring tools, a full understanding of what's happening also relies on other data – service tickets from the ITSM tools, changes from the CI/CD platforms, user behaviour from the product analytics tools, and third-party dependencies that publish their own status.
It's for good reason that operational data is scattered across a sprawl of tools.
The single-pane-of-glass paradox
When you have n tools, it’s hard to troubleshoot when things go wrong, and it’s impossible to be sure that everything is going right.
Enter ‘the single-pane-of-glass’ – one place to see everything.
But what is a single pane of glass? How do you create one? Early attempts at a single-pane-of-glass focused on aggregating alerts from multiple tools into one place. The result was an overwhelming deluge of alerts that were noisy, lacking in context and effectively unactionable.
More recent attempts to build a single-pane-of-glass take a brute force approach: if you want one place to see everything then bring everything into one place. The solution is a single monolithic tool that copies and stores data from across the engineering stack, similar to the data warehouse or data lake that business teams attempt to create for BI purposes. Like those business data warehouses, creating and maintaining a central platform for all your operational data takes a colossal effort, incurs a great expense, and is forever one step behind the changes happening in the engineering stack.
It's not only impractical to implement a monolithic data store of everything – it rarely achieves the desired outcome. All that centralized data sits behind a complex analytics interface, requiring a centralized team to provide answers for the individual users looking for insights, and struggling to do so because they don’t have knowledge of the systems and processes the data describes.
The result is yet another silo of data, and you now have n+1 tools.
There is a better way.
Decentralized data and centralized visibility
In a world where APIs provide ubiquitous access to data, it's possible to achieve the benefits of centralized visibility while leaving the data where it lives, in the tools specialized for each area of operations. Instead of collecting the data into a data warehouse or data lake, we can connect the data, stitching it together into a data mesh.
Three important elements come together to enable the observability data mesh: firstly, connect every data source into a standardized API access layer, then correlate across data sources by indexing the metadata in a unified object graph, and finally, enable collaboration between teams using interconnected workspaces.
Here’s how it works.
Connect – the API access layer
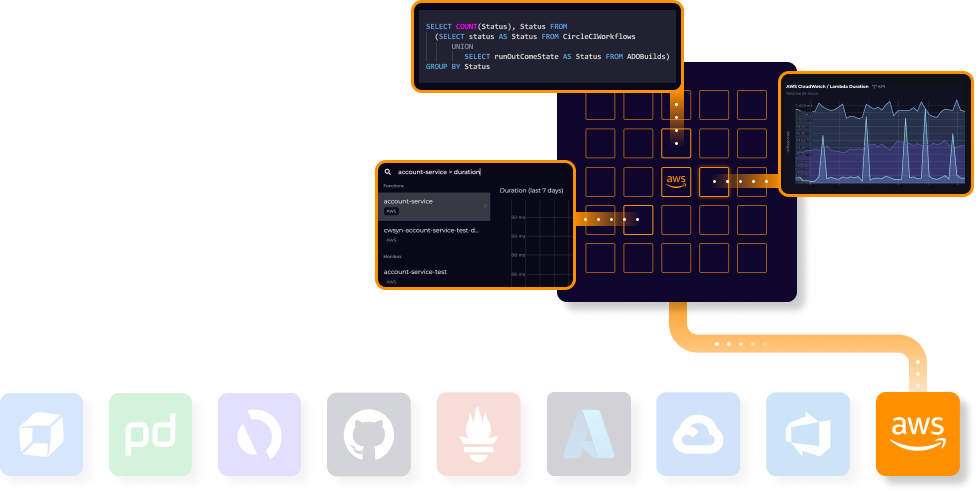
Powered by an extensible set of plugins, SquaredUp's unified data access layer connects to over 100 APIs across your engineering tool stack. Each plugin deals with the messy APIs and presents the data as a standardized, semantically described dataset. This makes it easy for users to find and access the data they want without becoming an expert in every tool. They can also manipulate and use the data to get the insights they need: datasets can be visualized and analyzed, monitored, and even queried using SQL. It’s as if the data is all there in one place, right at your fingertips.
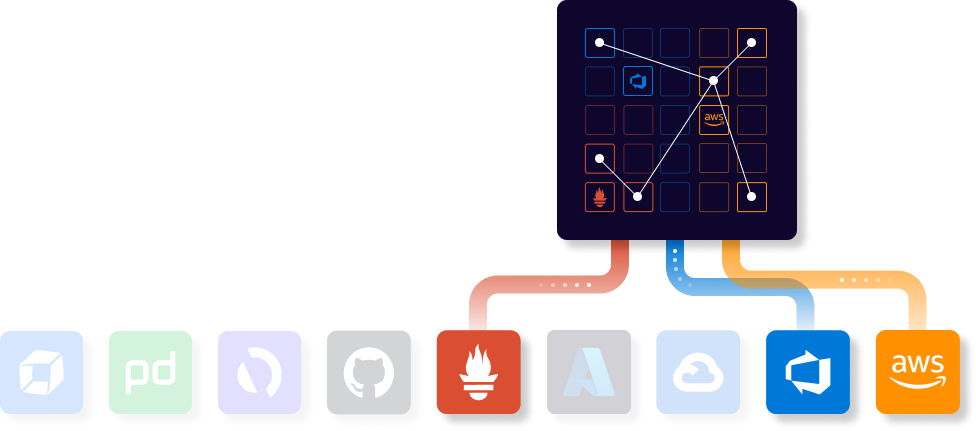
Correlate – the unified object graph
The hardest questions require making connections across data sources. Which code changes recently deployed into this environment? Which team is responsible for these cloud costs? Which customers are impacted by this issue? When SquaredUp connects to each data source, it indexes the metadata into a unified object graph (think social network graph, not line graph). Combined with the API access layer, the object graph enables users to explore, traverse, and combine data across tools to solve problems faster than ever before, and discover insights that would otherwise remain out of reach.
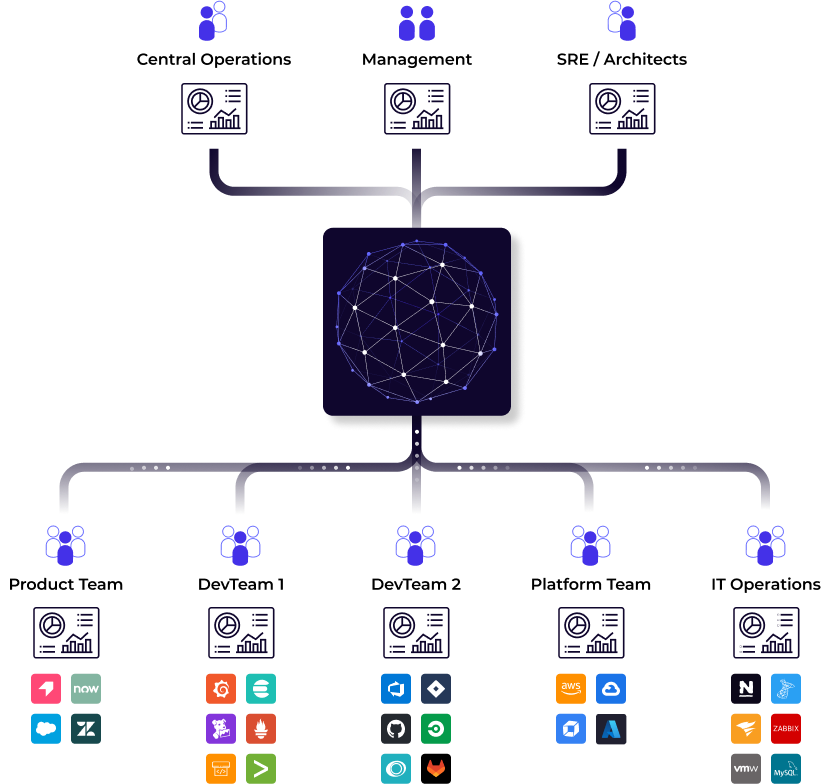
Collaborate – connected workspaces
Observability needs an extra ingredient beyond just data: knowledge. Workspaces enable teams with knowledge of each system to independently get the answers they need, and surfacing high-level summaries to the rest of the business in the form of status and KPIs. Workspaces are flexible and fit your organizational design: Infrastructure teams can proactively ensure the systems stay healthy while surfacing status to the teams that depend on them. Microservice teams can monitor the internals of their service while sharing status and SLOs to aid troubleshooting across complex business processes. Product teams can report application performance to business stakeholders. Put together, everyone in your organization gets the visibility they need.
A single pane, without the pain
Data mesh solves the single pane of glass problem by connecting your data – and your teams – instead of just collecting the data. With it, you can embrace tool sprawl rather than fight it, enabling your teams to choose best-of-breed tools, while connecting insights across teams for end-to-end visibility. No copying of data, no expensive data storage, and no new data silo, just unified visibility.
Other tools were very expensive because they charge by the amount of data ingested. The model SquaredUp uses – streaming data on-demand, ingesting only metadata and leaving the raw data in place – is a much better way of doing it
Find out how Arup built their ideal observability solution with SquaredUp. Read the case study.
Discover the data mesh.
Data all over the place, answers in one place.

The Single Pane of Glass in Modern Observability
What is a single pane of glass? Does it have practical applications? How does it fit into modern observability?

Observability at Scale Needs Summary
The shift from traditional monitoring to observability is widespread, and necessary. It’s the way we make sense of increasingly complex and distributed systems. But when we capture all this data at scale… what do we do with it all? If this data itself had inherent value, we’d all be rich. But in the real world…

Bad Observability
There’s plenty of content out there telling you how to implement observability, or what good looks like. But what about bad observability?
