User Stories
How Arup centralized visibility across 90+ offices and 3 clouds — without a data warehouse
Arup needed org-wide visibility without sacrificing team data ownership. Most tools forced a trade-off. SquaredUp didn't.
We wanted to create a modern observability platform with the tools we already had. SquaredUp provided the missing visibility piece.
Anthony Ashmead
Enterprise Monitoring Lead
The challenge: monitoring a global firm mid-migration
When you're moving 18,000 people from on-premises infrastructure to the cloud, blind spots are dangerous. Arup — one of the world's leading architecture and engineering consultancies — found themselves managing five distinct technology teams, each with their own stack, their own tools, and their own slice of a sprawling multi-cloud environment spanning Azure, AWS, and beyond.
Leadership set a clear mandate: consolidate monitoring across the organisation. The catch? Teams couldn't lose ownership of their data, and building a central data warehouse wasn't on the table.
"Our main problem was capturing our complex infrastructure monitoring. The data was across Azure, AWS, and other tools — and we didn't have a central place to see all the data and do comparisons."
The result was a fragmented picture. Incidents were harder to trace across service dependencies. Management had no clean view of performance or cost. And visibility gaps during a critical cloud migration meant problems could surface late — or not at all.
What they tried first
Arup didn't settle on SquaredUp without looking at alternatives.
Power BI fell short immediately. Building meaningful dashboards required complex queries and analyst expertise that the average team member didn't have. Scaling it across five teams with different stacks wasn't realistic, and manual reconfiguration made it brittle.
Traditional observability platforms raised a different concern: data ingestion costs. Centralising everything into a monolithic repository would be expensive and would undermine the team autonomy Arup needed to preserve.
Native cloud dashboards from AWS and Azure simply couldn't span multiple accounts or clouds — a dealbreaker for a firm operating at Arup's scale.
Why SquaredUp
Three things made SquaredUp the right fit.
No centralisation required.
SquaredUp's data mesh approach leaves raw data exactly where it lives. Rather than ingesting and duplicating data into a central store, it indexes and connects using metadata. For Arup, that meant no storage overhead, no data movement costs, and no battles over who owns what.
Other tools were very expensive because they charge by the amount of data ingested. The model SquaredUp uses – streaming data on-demand, ingesting only metadata and leaving the raw data in place – is the only viable way at the scale we operate at.
Teams could move fast.
With 100+ pre-built plugins covering AWS, Azure, SCOM, VMware, Solarwinds, and more, teams connected their tools and built dashboards without needing a data analyst. Point-and-click setup meant adoption wasn't gated on specialist resource.
Having the plugins in SquaredUp makes connecting data sources point-and-click, whereas other tools were forcing us to work with the APIs ourselves.
One view from the ground up.
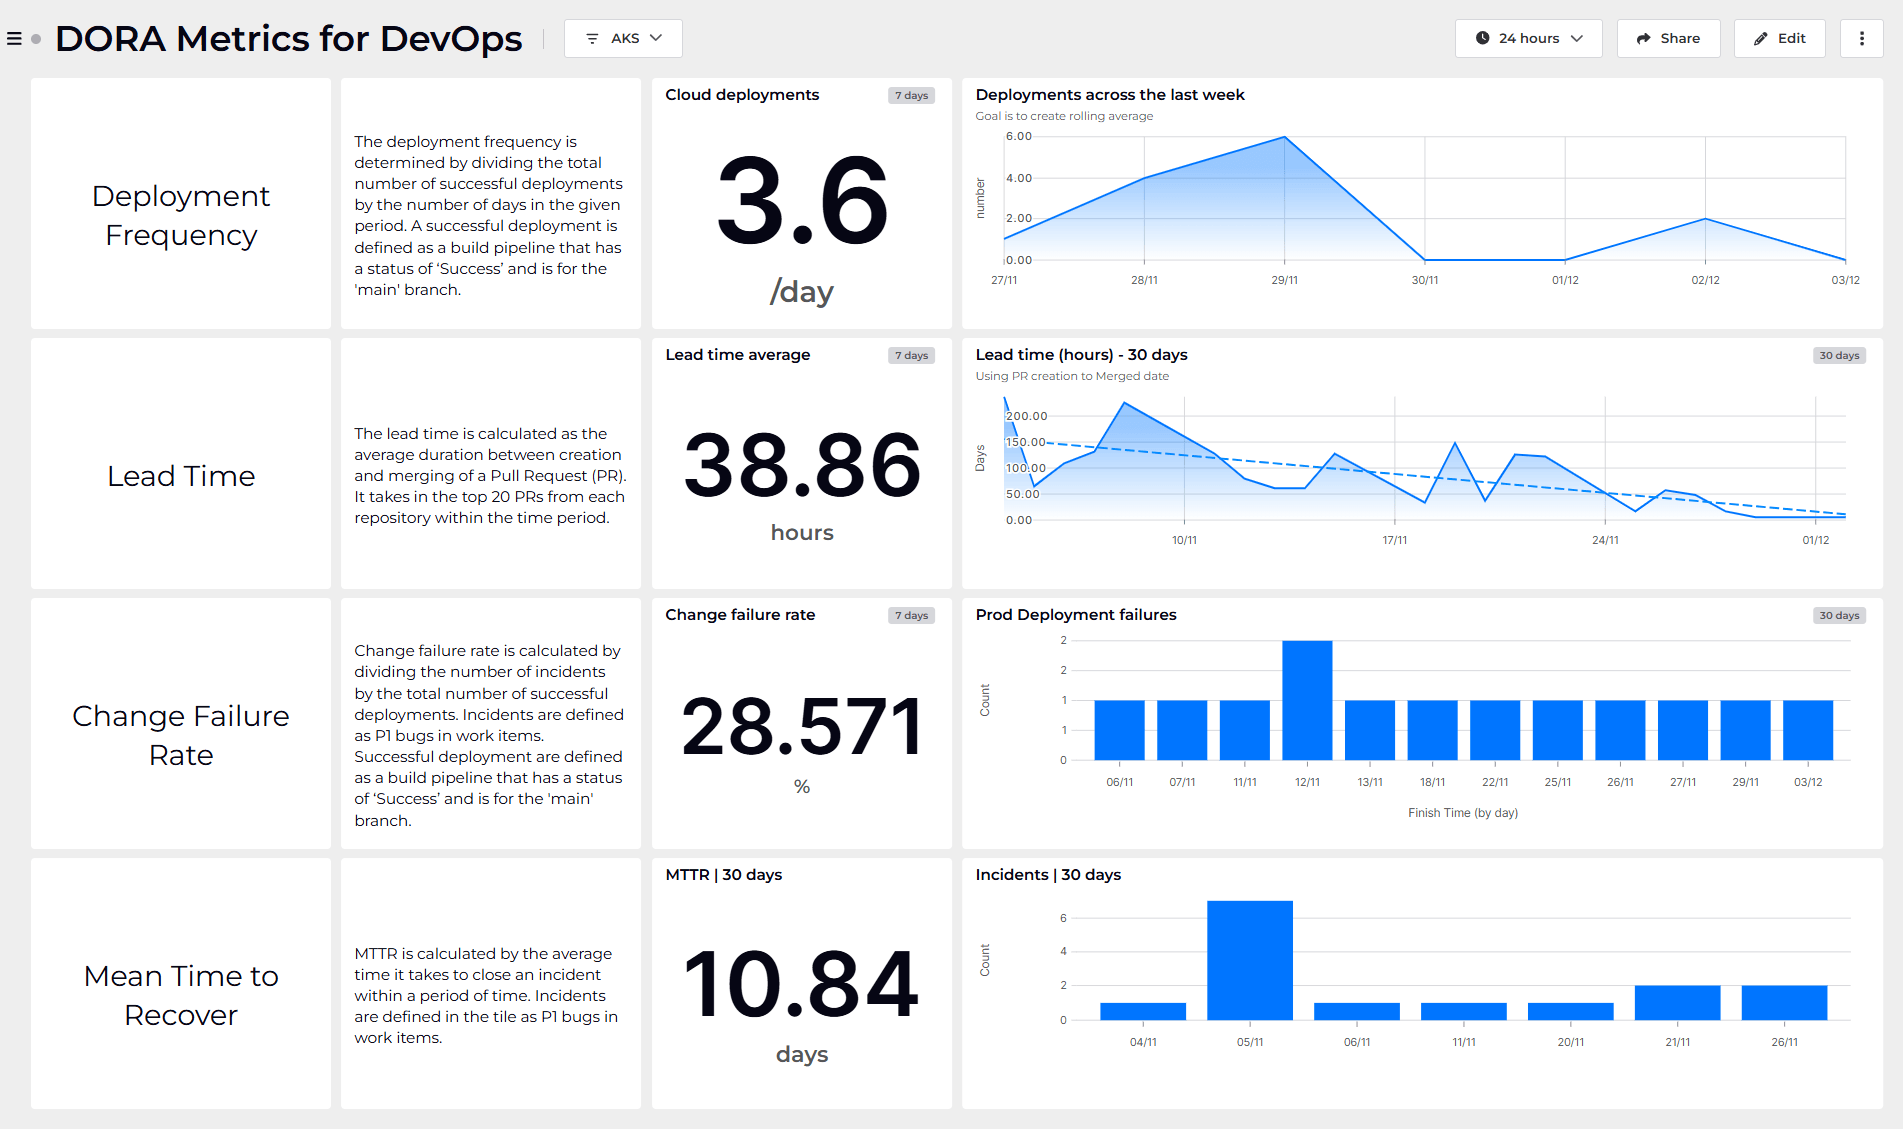
Dependency mapping and status roll-ups gave management a clean, high-level picture of performance and cost — while engineering teams could drill into the detail they needed for daily stand-ups and incident response.
The self-service piece is huge. Plus, there are the blind spots that the integrations cover. It’s a double win.
The Result
SquaredUp became Arup's single platform for infrastructure visibility across the entire organisation. DevOps teams use it in daily stand-ups. Enterprise monitoring teams rely on it for cross-stack awareness. Management gets clear reporting without chasing engineers for summaries.
Five teams. Multiple clouds. One place to look.
Visualize over 60 data sources, including: