Vincent Babin
Senior Product Manager, SquaredUp
Applications are built and run by many people and made of many components: infrastructure, code pipelines and end users to name a few. Understanding the status of those components and teams is never straight forward.
In this blog, we will be unpacking the problem faced by most organizations and taking a look at how SquaredUp can empower you and your organization with status visibility across different teams / components / services – all in one view.

I used to work for a company whose revenue was made from selling subscriptions for its world-famous online publication service. Any outage could impact our company’s bottom line. The service was developed and maintained by 4 Engineering teams and 1 DevOps team, each responsible for a specific area of the service (authentication, front-end, back-end, content delivery, subscription management).
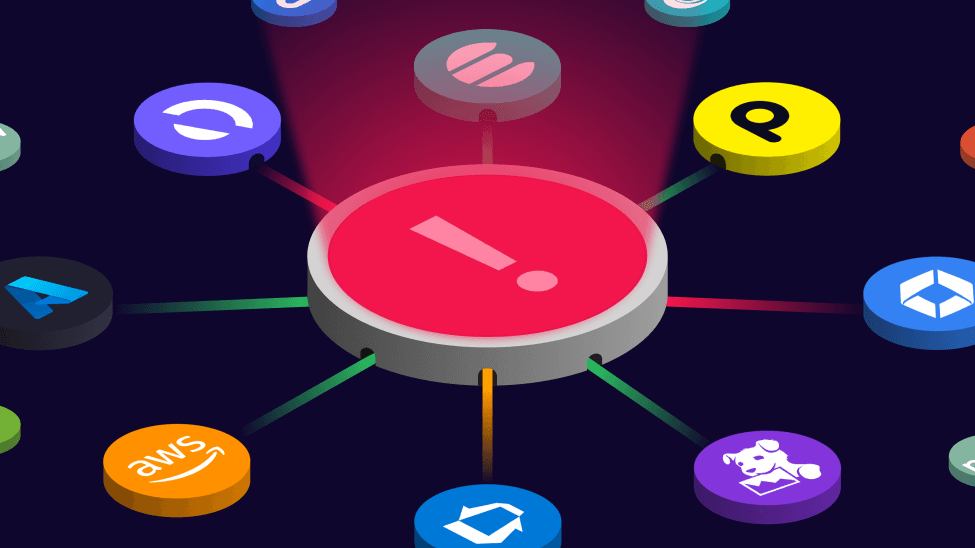
SquaredUp enables an organization to plug into any tool and surface real-time status. With 50+ plugins, each team can capture and share important information about their own component – what it is, what its dependencies are, and what the status is. No data is centralized and stored; every plugin streams its data, meaning teams can keep the tools they love.
SquaredUp plays nicely across teams – centralized visibility that keeps ownership decentralized. DevOps and Engineering teams can choose to publish any data they need from the tools that they use: key metrics, logs, alerts, documentation, pipeline releases – anything that other teams might need to quickly determine the root cause and impact of an outage.
Let’s take a closer look at how it could help my company. The dashboard below gives an overall status of the application. In this example, every stakeholder can see that:

Because every team has their own dashboards with their own metrics to define their own monitors, it is possible to further drilldown and explore the status of sub-components. In this example, we can see that there was a recent release that failed, but more importantly, that the AWS Lambdas underpinning the subscription management service are erroring out.


The DevOps team can now take immediate action and work with the Engineering team to initially reverse the deployment and fix the code.
When individual teams roll-up their health and key metrics, SquaredUp automatically creates the relationships between components. SLOs and KPIs can then be derived and aggregated to add more context and insights to these status dashboards.
To see for yourself what SquaredUp can do for your environment, get started today for free with our out-of-the-box dashboards that will have you up and running in minutes.
Or, to find out more:
Senior Product Manager, SquaredUp

Getting started with SquaredUp is free and easy. Our free tier includes: