John Hayes
Observability Advocate, SquaredUp
A look at how DevOps leaders can use SquaredUp to view SLOs and key metrics in one single pane of glass.
If you are a DevOps manager, you will be keenly aware that the role involves managing multiple toolchains across different clouds, platforms, and environments.
You also need to report on KPIs, DORA metrics, governance, security, and a lot more. At SquaredUp, we understand these demands and have developed a suite of plugins and ready-to-run dashboards to help you reduce toil as well as pull all of your key analytics together within a single pane of glass.
In this article, we will look at how SquaredUp dashboards can give you the visibility you need in five key areas:
Over the past few years, DORA metrics have established themselves as the gold standard for measuring DevOps team performance. While these metrics can have great value, querying across the relevant backend systems can be painful, involving multiple APIs and protocols.

This article, by our Director of Engineering Excellence Tim Wheeler, shows how SquaredUp’s powerful Data Stream technology does all the heavy lifting for you. The article walks you through connecting to data sources and using SQL and WIQL queries to pull exactly the data you need to visualize metrics such as:
Managing cloud costs is now a key part of a DevOps manager’s role. Whilst cloud platforms provide cost analytics, capturing and, equally importantly, sharing the relevant data can be cumbersome - especially in multi-cloud environments. DevOps managers also need to go beyond tracking costs and aligning with budgets. They also need to optimize usage and seek out waste.

Evidi is a leading Scandinavian managed service provider, and in this article, Andre Ghanima, a DevOps developer with the company, gives an overview of how they use SquaredUp dashboards to help their customers reduce their cloud running costs. Using SquaredUp’s Azure plugin they can display the standard Azure Cost Advisories, but they can also dig deeper into the Azure platform and provide detailed recommendations on right-sizing as well as visualizing the results of Kusto queries.
Shifting security left is a fundamental DevOps principle, and with SquaredUp you can use either our dedicated plugins or our Web API data source to connect to any tool on the market that supports a REST API.

This dashboard shows how you can use our Web API data source to connect to the SonarCloud REST API and easily surface key metrics on code quality and potential vulnerabilities. You can also create monitors for categories such as critical issues and these will automatically be rolled up to higher level workspace and organizational dashboards.
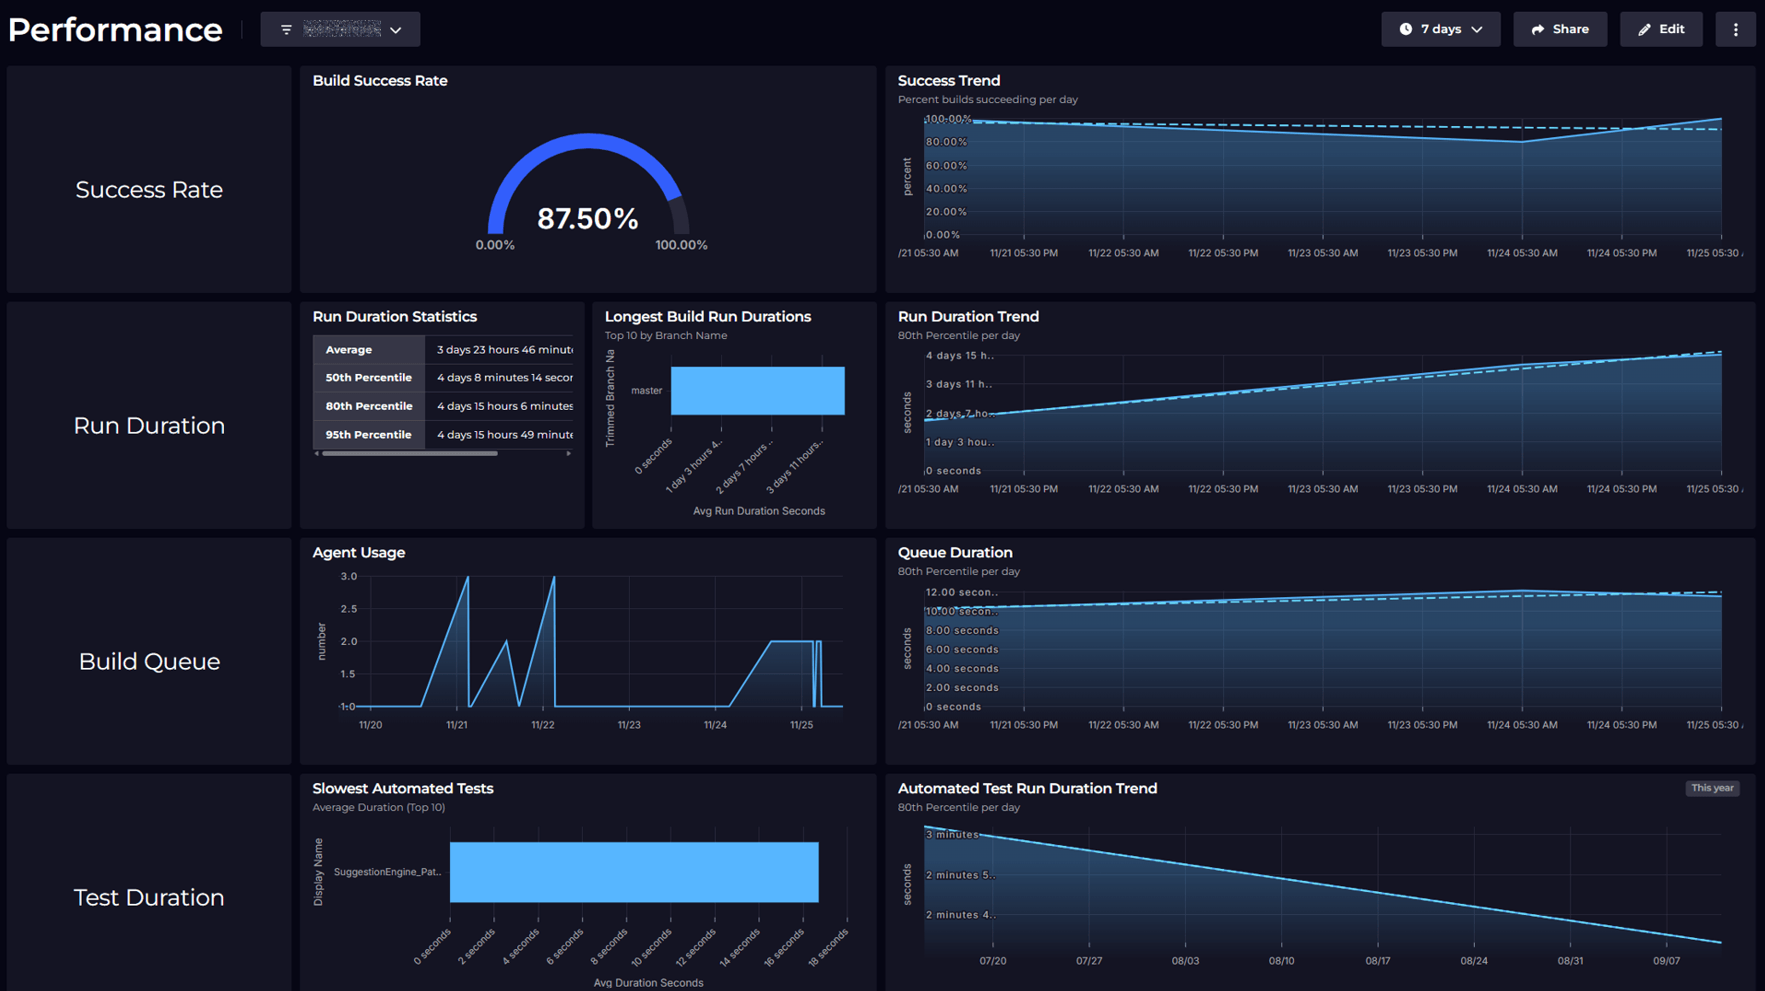
Service Level Objectives are a valuable tool for ensuring that the performance of your systems and services aligns with the needs of your business. It is vital to capture these metrics and share them with stakeholders.

This blog article describes how you can create a CTO dashboard that displays key metrics at a glance, but also takes advantage of SquaredUp's powerful multi-level graph capabilities to drill down from a high-level service map and view underlying resource health. No other tool on the market can provide you with this much breadth and context.
Proper governance is essential to building secure, maintainable and cost-effective cloud environments. This involves multiple strands of activity - from decommissioning unused resources to following security recommendations. Putting the necessary oversight in place can involve bringing together data from numerous different endpoints and data sources.

This cloud governance dashboard, built by Evidi, demonstrates how SquaredUp can identify orphaned resources and surface Defender and Azure Advisor recommendations - all in a single pane of glass.
We have covered a lot of ground in this article but this only gives you a glimpse of the tools available in SquaredUp to enable DevOps managers to gain the oversight they need.
SquaredUp has over 70 data sources including AWS, GCP, Jenkins, GitHub, Circle CI and many more. Our unique roll-up capabilities enable you to create hierarchical views with drill down and our unlimited dashboard sharing means that you can keep all relevant stakeholders in the loop.
Observability Advocate, SquaredUp

Getting started with SquaredUp is free and easy. Our free tier includes: