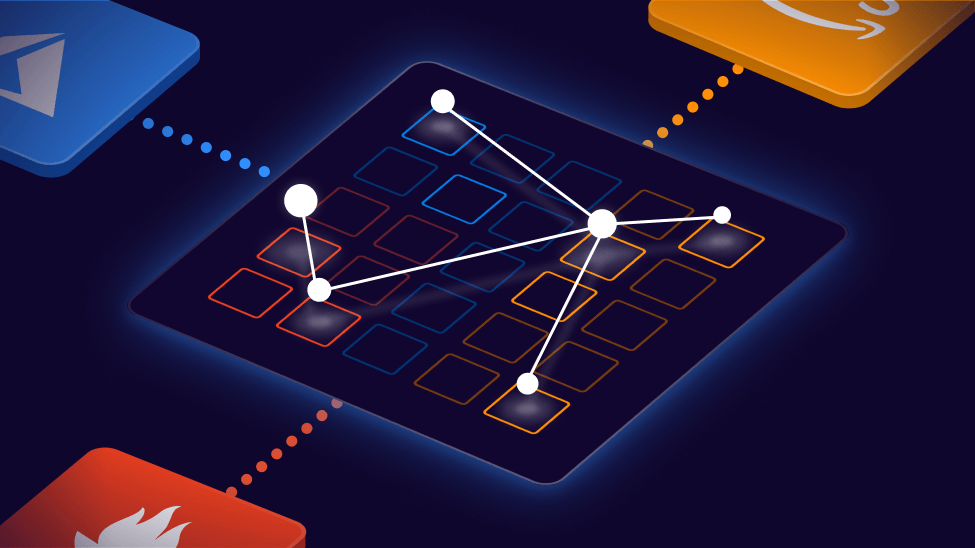
Total visibility. At any scale.
Only pay for insights, not data. (No per GB ingestions fees, no storage costs.)
Only pay for insights, not data. (No per GB ingestions fees, no storage costs.)
Free dashboards. No strings.
Billed annually
Scale up your dashboarding
Billed annually
Multi-team insights
Billed annually
Unified visibility at any scale
Billed annually
| Usage limits | Free | Starter | Pro | Enterprise |
|---|---|---|---|---|
3 | 10 | Unlimited | Unlimited | |
Up to 2 | 3 included, additional $25/month | 5 included, additional $35/month | 5 included, additional $55/month | |
1 dashboard | 3 included, additional $15/month | 10 included, additional $15/month | 20 included, additional $15/month | |
Up to 10,000 | 20,000 included, $12/month per 10,000 | 100,000 included, $12/month per 10,000 | 200,000 included, $12/month per 10,000 | |
50,000 included $12/month per 1,000 | ||||
Community | Online | Online | Dedicated |
| Dashboarding | Free | Starter | Pro | Enterprise |
|---|---|---|---|---|
| Sharing | Free | Starter | Pro | Enterprise |
|---|---|---|---|---|
| Plugins | Free | Starter | Pro | Enterprise |
|---|---|---|---|---|
| Monitoring | Free | Starter | Pro | Enterprise |
|---|---|---|---|---|
15 minutes | 5 minutes | 1 minute | 1 minute | |
| Map | Free | Starter | Pro | Enterprise |
|---|---|---|---|---|
| Access control and collaboration | Free | Starter | Pro | Enterprise |
|---|---|---|---|---|
| API and automation | Free | Starter | Pro | Enterprise |
|---|---|---|---|---|

Getting started with SquaredUp is free and easy. Our free tier includes: