Sameer Mhaisekar
Developer Advocate, SquaredUp

Developer Advocate, SquaredUp
There’s a new Azure agent in town – Azure Monitor Agent (AMA). I hear you saying, “Wait, aren’t there already enough Azure agents?So why another new agent?” A very valid question!
Indeed, there are already a few Azure monitoring agents: the Log Analytics Agent, the Diagnostic Extension agent, and the Telegraf agent (and also the Dependency agent if you want to count it separately). We’ve discussed these in quite some depth in one of our earlier blogs, covering what the function of each agent is and how they differ from one another. If you aren’t familiar with these agents, I’d recommend you take a look quickly so you’ll be able to keep up here.
So, what is this agent and what does it do?#
What is this AMA then? It is actually a rather welcome addition that is Microsoft’s first attempt to combine all the other agents. The other agents are very well defined in terms of what they can and can’t do. This makes it somewhat inconvenient to choose the right one and implement it en masse. Log Analytics agent for example, can be centrally managed but can’t be configured granularly. Diagnostic agent on the other hand can be configured granularly, but there’s no central management. This makes it a pain to manage your data collection and effectively also not optimal in terms of cost.
So how does this new AMA fit in with the existing ones? Like mentioned earlier, this agent is being introduced to essentially replace the “old” ones. It’s still in preview as of writing this, so essentially not completely ready yet. So expect to see some more developments until it goes live!
The methods of data collection are very different for the existing agents, and they also differ in the destinations where they can save the data in. The diagram below should give you a quick summary at a glance for Windows servers.

The AMA intends to eliminate these limitations of the different agents and be able to provide you a centralized management while giving you the ability to collect different data for different VMs and send them to any destination of your choice, may it be Azure Logs, event hub, Metric Explorer, etc.
With this new agent, Microsoft has also introduced a different data collection method, called the Data Collection Rules (DCR). You can create different rules for the different performance data types you wish to collect per group of VMs. Let’s see how that works.
Under Azure Monitor portal, find Data Collection Rules under Settings.

Create a new rule by clicking on the + button on the top. Give your rule a name and select the subscription and a resource group to save it in.

Next, you will see a screen to choose the VM’s you want to run this rule on.

Once you’ve selected the VM’s, you now have to choose what data you want to collect by adding a data source. Selecting each option will give you a further prompt to select the counters, event logs, etc.

Note the Destination button at the bottom. Here you will get to choose where you want to send the data. If you choose Azure Monitor Logs, you need to specify a workspace. If you select Azure Monitor Metrics, it will be sent to the Metric database.

Cool. That’s it, you’re done! Now, to collect data for a different set of VMs, repeat the process.
To make sure that this has actually gone through, quickly jump into one of the VM’s you selected in the scope and look in Extensions. You will see the AzureMonitorWindows(or Linux)Agent installed. Woohoo!

I really like this change and I think it’s fantastic to combine all agents together to give you a unified experience. I especially like the ability to collect different set of data for different VM’s at different intervals. Really helps with trimming down the budget too, as without this agent, you currently have to collect everything for all the machines in a workspace at the same interval, which leads to a lot of unnecessary data ingestion and hence increases the cost.
However, as much as I’m loving the new experience, I’d advise you to wait it out a little. This is still in preview, and hence still a work in progress. What I showed you above is the only thing you can do with it at the moment. For other services like Solutions, VM Insights, etc. you still need the old agents. It also doesn’t support all the OS versions that the existing ones do.
If you’re eager to try it out, and don’t mind frequent changes/improvements, or maybe even the occasional downtime etc., go ahead and play around with it. Maybe use it for your less critical/test machines, but I’d suggest waiting a little until you use it in production.
That’s about it for now folks. Microsoft has great documentation where this is explained in a lot more detail. I’d encourage you to check it out.
Cheers
Developer Advocate, SquaredUp

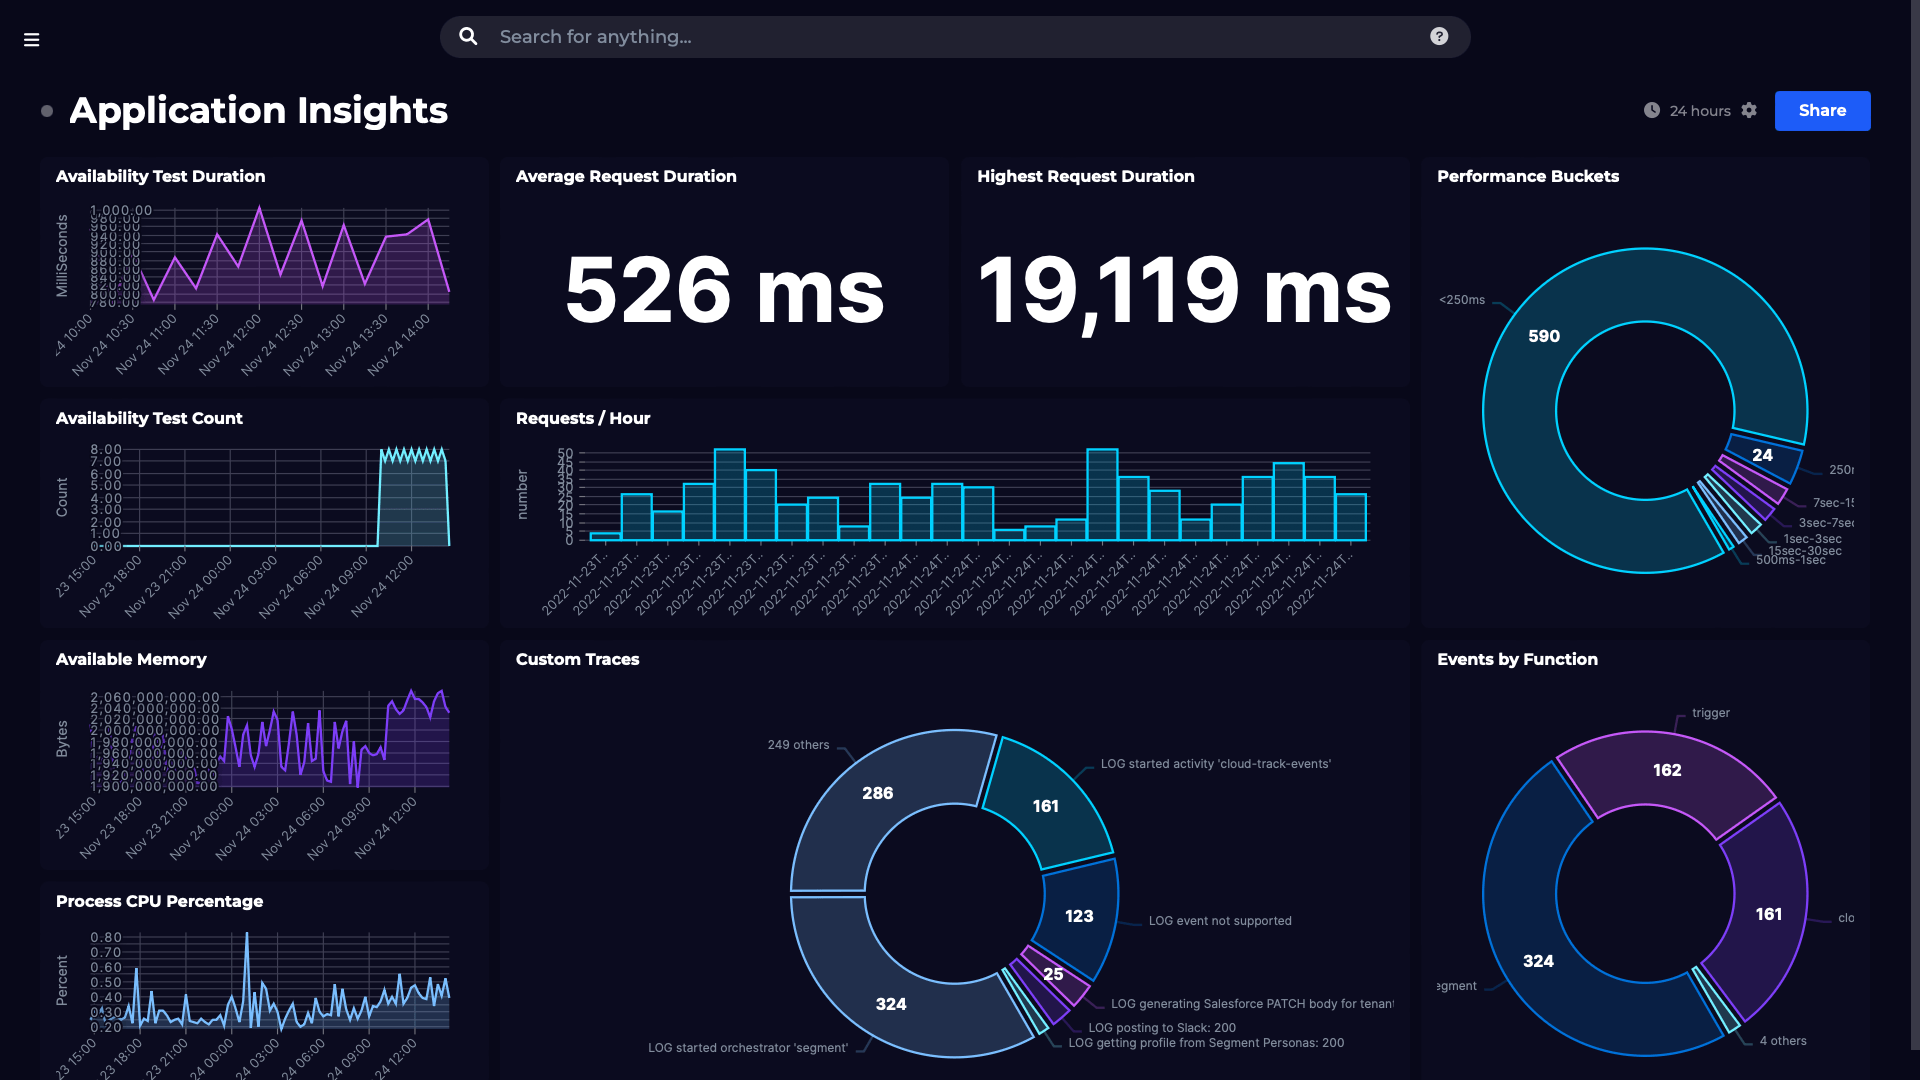
Monitor your Azure Application Insights environment using custom Kusto queries.
Dashboard Story
Dashboard Story
Dashboard Story

Here's what our free tier includes: