Bruce Cullen
Director of Products, SquaredUp
These Jira dashboards give a clear overview of your Jira instance and provide more details on the key items over which the engineering team needs oversight, like build status, critical bugs, and costs.
Director of Products, SquaredUp

Teams using Jira need to track bugs to know where there are defect clusters, how many bugs are being raised vs. closed, and whether there are any critical bugs. You also want to track the status of your builds and how robust they are. Plus, you want to stick to the budget for Azure infrastructure costs, for example.
Although Jira has a native dashboarding capability, the dashboards are only as good as the Jira data and, as an engineering team, you need to be able to see data from more sources than Jira. Plus, Jira doesn’t provide a way to create metrics and dashboards showing the detail you need while also rolling up the statuses of KPIs to centralized project management or release teams.
There needs to be a centralized place to roll up all the data from across the teams and use cases to get a unified view.
By using the Jira plugin to create Jira dashboards in SquaredUp, the Engineering Team can create their own dashboards and display all the metrics they need, from bug severity to the status of build runs. At the same time, they can roll up KPIs using the KPI feature and red-amber-green (RAG) status tile for health status so management can get an overview of performance at a glance.
Creating Jira dashboards in SquaredUp means Engineering Management doesn’t have the additional work of collating all the detailed Jira data to make sense of it from a high level. It also enables Release Teams to more easily consume data surfaced from all the engineering teams, while still being able to drill into the details of each dashboard as needed.
Setting up a Jira dashboard in SquaredUp is simple. You just need to provide the URL for your Jira cloud instance, a name, username, and an API token.
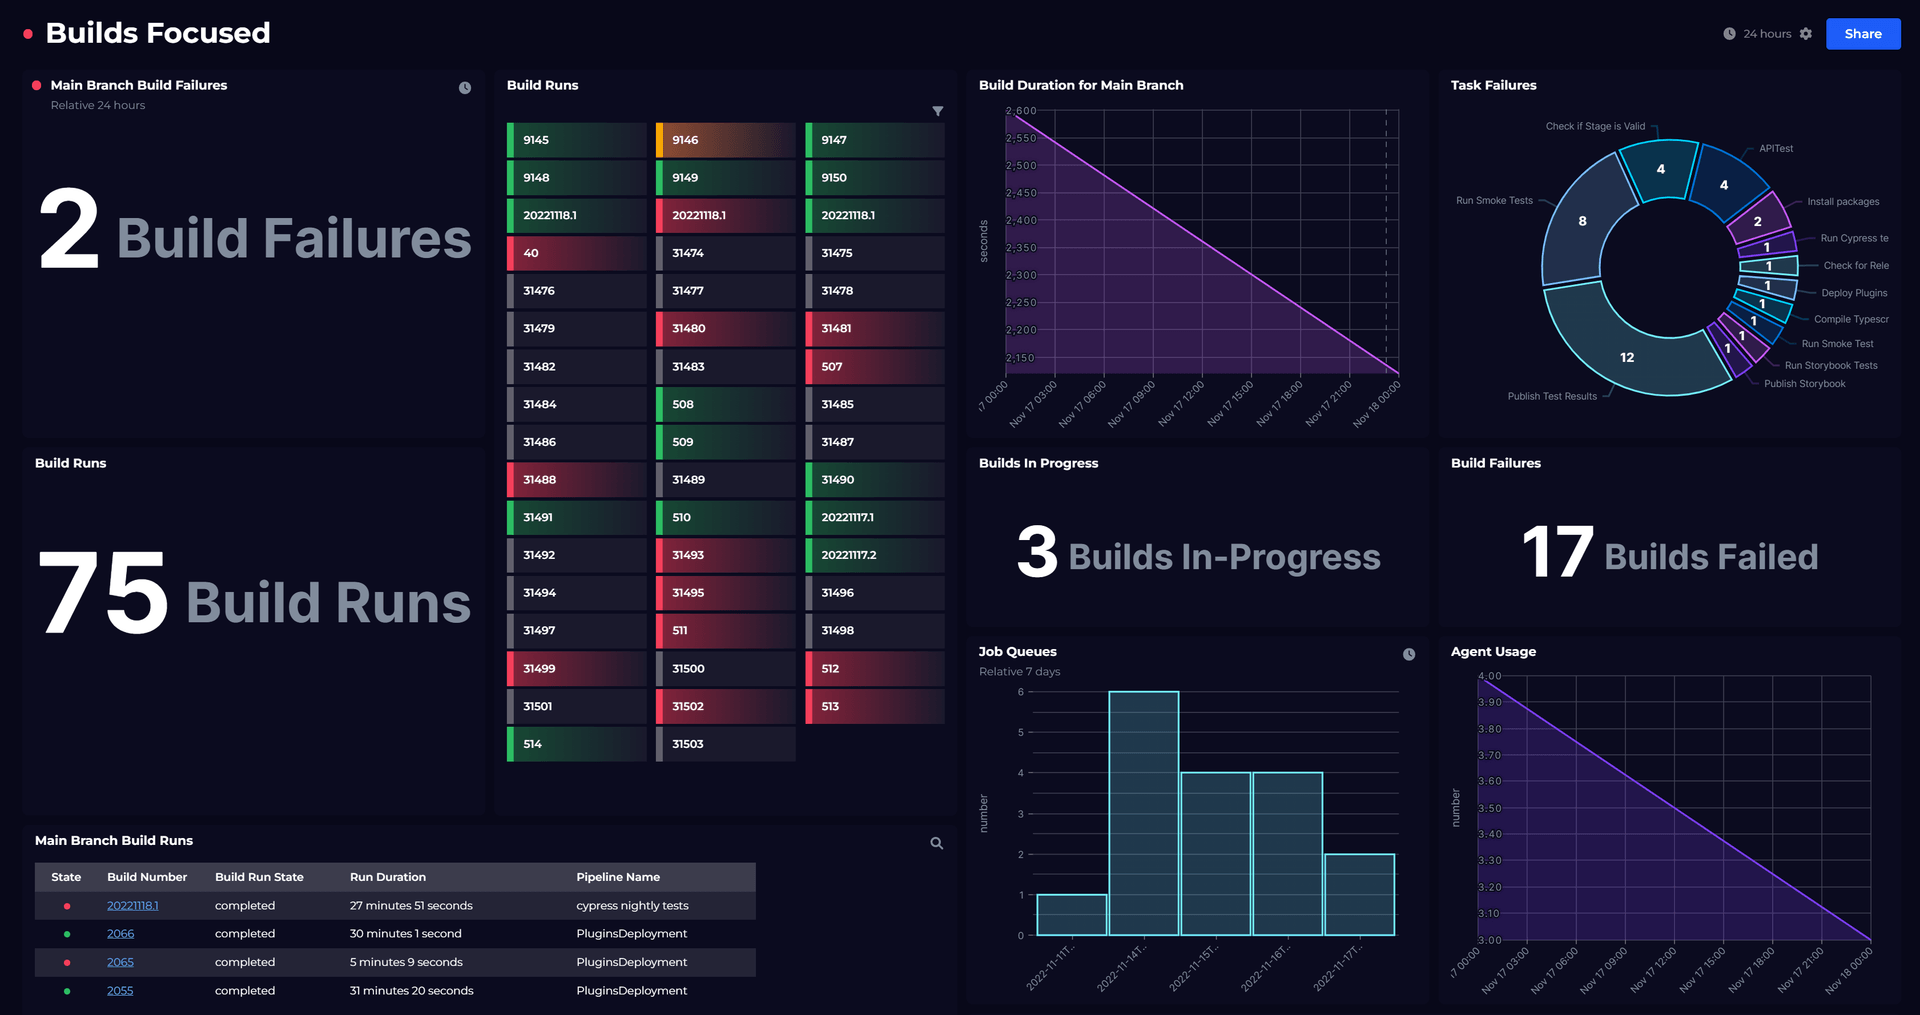
The first Jira dashboard lets the Engineering Management team get a fast overview of bugs, Azure cost data, and DevOps build information for build jobs. This dashboard was created by inputting JQL directly into the SquaredUp dashboard.
Here’s a breakdown of what the above dashboard shows.
Monitoring and taking action on bugs with Jira data:
Azure infrastructure cost monitoring:
Azure DevOps build information:
These next three dashboards are the more detailed, team-level dashboards.
The first is the story dashboard that provides oversight of the story by component, the stories in progress, including the backlog and the number closed by both quarter and in the current year. There is also a tracker for the epics in progress, the backlog, and the number closed.
The Jira dashboard for bugs gives greater detail into the details of the critical bugs, the open bugs by component, the bug raise and close rates, and the number of bugs by priority.
Finally, there is also the release overview Jira dashboard that provides insights into the progress status of each release, the stories and epics that have been recently started, as well as the epics and bugs by priority.
These Jira dashboards are not available out of the box, but you can easily build something similar yourself using the Jira plugin.
Simply create a free account to get started, or check out this video to see how easy it is to use our Dashboard Designer:
To see what other dashboards you can create, including Azure dashboards, and Azure DevOps dashboards, check out our Dashboard Gallery.

Integrates with Jira Service Management and Jira Service Desk

Visualize and monitor the projects, releases, and issues from Jira software.
Dashboard Story

Dashboard Story
Dashboard Story

Here's what our free tier includes: