Blog


We did it! SquaredUp is now a B Corp
It's been a journey - but we're delighted to finally announce our B Corp certification. Here's the story of how it happened...

Top 5 dashboards for DevOps leaders
How DevOps leaders can use SquaredUp to view SLOs and key metrics in a single pane of glass.

Operational Intelligence - the new horizon of observability
The evolution of observability into intelligent, real-time decision-making.

How Evidi built the perfect MSP single pane of glass
Evidi has created the ideal suite of dashboards for MSPs – a customer health overview dashboard that drills into one workspace per customer. Learn more.


Latest blogs
Getting started with Azure cost dashboards
In this article we will use run through how to create insightful Azure cost dashboards in SquaredUp – from setup through to pre-built dashboard templates.

How to avoid blowing the budget on Azure AI
Consumption and cost reporting are often on very different timelines. Learn how we've used a simple solution to solve the very real problem of the cost of AI.
Perses – A new language for dashboards?
A discussion of the Perses project and a walkthrough for creating and uploading a Perses compliant dashboard.

Getting started with Postgres dashboards
Learn how to query, analyze and visualize your Postgres data in SquaredUp dashboards.
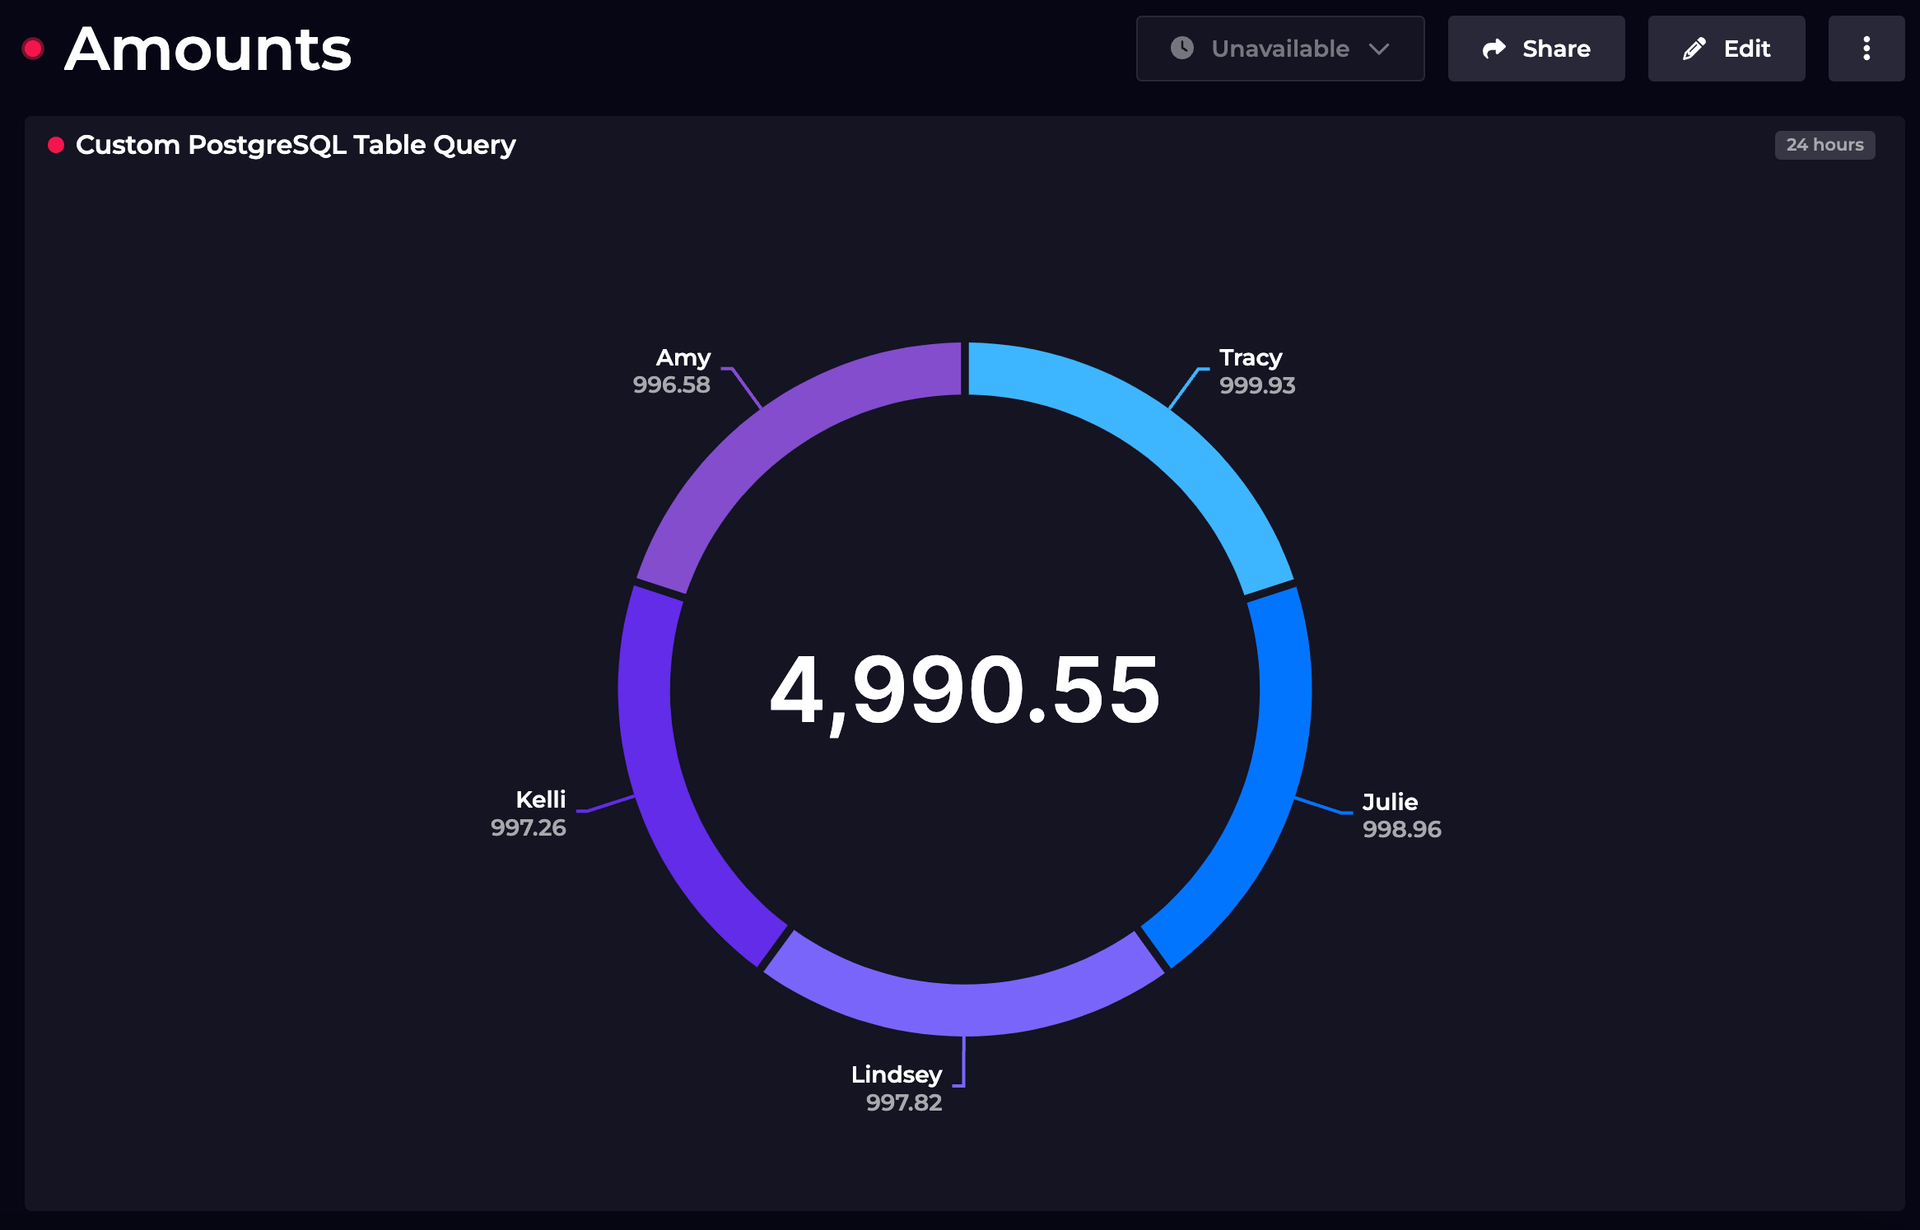
Getting Started with the PostgreSQL Plugin
With the SquaredUp Postgres plugin, you're not just getting all the benefits of open source Postgres - you're also getting our exceptional dashboarding capabilities that work perfectly together.

Getting started with Snyk dashboards
How to use the SquaredUp Snyk plugin to create dashboards for your Snyk analytics.
Top 3 tools for M365 reporting: SquaredUp, M365 admin center & Power BI
Looking for M365 reporting tools? We pit three top tools – SquaredUp, Microsoft's admin center and Power BI – against each other to see which comes out top.
Top 3 Zendesk reporting tools: Explore, Power BI & SquaredUp
Need better Zendesk reporting? Compare Zendesk Explore, Power BI, and SquaredUp to visualize key metrics, improve customer satisfaction, and optimize support team performance. Find the right tool for you.

Getting started with SCOM dashboards
We take a look at the SCOM plugin and see how easy it is to create dashboards with it, alongside the cool templates you get out of the box.

Getting started with PowerShell dashboards
In this blog we discuss how you can turn your PowerShell scripts into useful dashboards and share the insights which are otherwise difficult to share.

Getting started with M365 dashboards
In this article we take a look at creating insightful M365 analytics dashboards using the built-in M365 plugin for SquaredUp.

Analyze This! Notes from the Gartner IOCS Conference
Notes on the Gartner 2024 Infrastructure, Operations and Cloud Strategies Conference in London.
