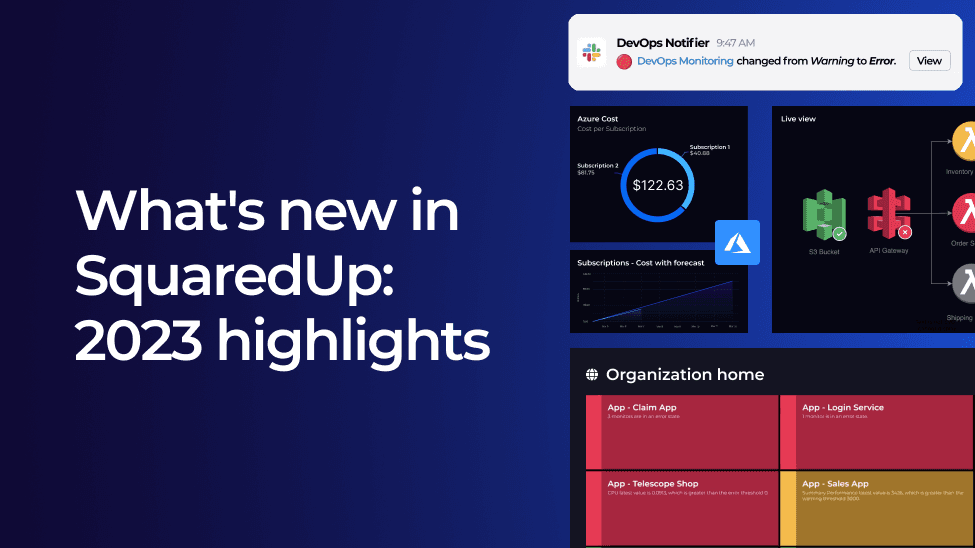
What's new in SquaredUp: 2023 June – Dec highlights
As 2023 draws to a close, we’re celebrating a full year since the release of SquaredUp Cloud – our revolutionary observability portal for product, engineering, and IT teams.
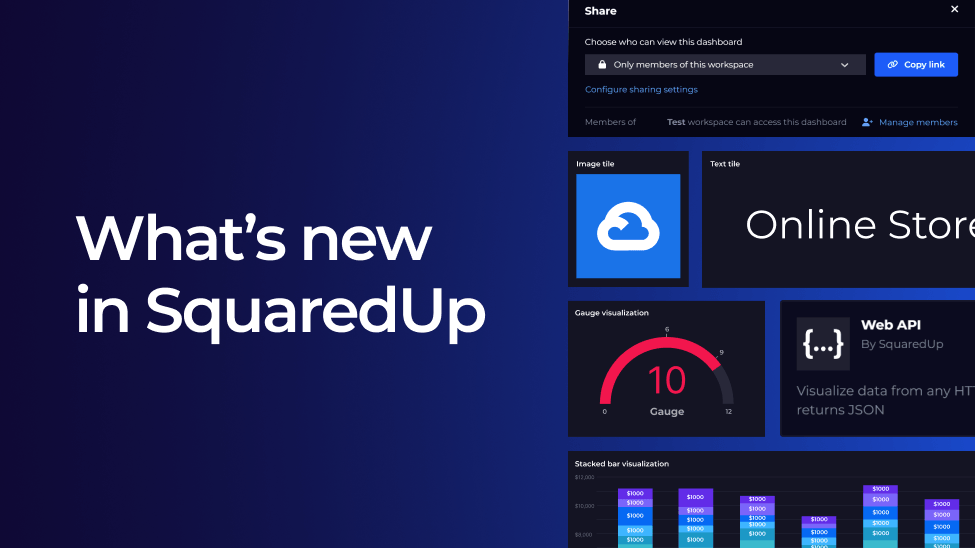
In the last six months, we’ve packed in a ton of product improvements, including new visualizations, even more out-of-the-box dashboards, and a fast growing suite of pre-built plugins.
Keep reading to learn about what we’ve delivered in the second half of the year:
Here's a snapshot of the improvements we'll cover:
- New and improved product plugins
- Impressive new features
- Dynamic visualizations
- New out-of-the-box dashboards
Check out our previous highlights blog to see the features we released in Jan – May 2023.
New and improved plugins
We now have over 60 pre-built plugins (and more on the way) that give you instant access to 100s of data sources across your organization.
To help you get even more out of your data, we’ve made major improvements to some of our most popular plugins:
Azure
Our Azure plugin now allows you to visualize and monitor Azure spend across multiple regions, tenants, and even other hybrid cloud services.
But cloud cost is a complicated beast, so we’ve worked hard to go beyond simply pulling cost information as it’s incurred. We now enable you to visualize:
- Reserved Instance purchases and consumption, to make sure you’re using up all of the reservations you’ve paid for.
- Amortized cost alongside actual cost, so you can effectively forecast and budget for the future.
- Budget forecasting and health, rolled up into a dedicated dashboard.
- Savings Recommendations through right sizing, reserved instances, and savings plans.
- Invoicing payment statuses broken down into ‘invoice parts’.
Designed to drive down your Azure spend, these latest updates provide full visibility of exactly where your money is being spent (or wasted).
To get you up and running straight away, we’ve created eight out-of-the-box Azure cost dashboards that are instantly loaded up with your live data when you add the Azure plugin to your workspace.
VMware vCenter
If you have a deployment of VMs, you’ll want instant visibility when servers go wrong, when tools need updating, or if you run out of memory.
With our VMware vCenter plugin, you can do all of that and more, all in one place.
Our most recent update means you can now surface over 60 new VMware data streams in your dashboards, including a full snapshot history.
View this alongside your disk space, memory, CPU, tool patch level, and more, in two out-of-the-box dashboards for a 360° view of your VM performance.
To see how simple it is to connect to VMware and start dashboarding, watch this short video:
Explore our extensive plugin library to see our latest additions, including Jenkins, IsDown, Prometheus, and more.
Features
SquaredUp has tons of unique features designed to derive real-time, contextual insights from your data.
Organization home
We understand the power of summary here at SquaredUp. You need one place to visualize the big picture so you can stay in control and keep your stakeholders in the loop.
That’s why we created Organization Home, a status rollup view of your environment’s workspaces, dashboards, and monitors.
With sort and filter options, this rollup view can be tailored to your needs, and used as a starting point when drilling down for greater detail.
Unified SQL Analytics
Our dynamic SQL Analytics editor allows you to carry out advanced manipulation of data using a SQL query before you visualize it. For example, you might ask “how frequently is the team successfully deploying code to production?” or “What is the average time difference between a ticket being created and resolved?”.
You can easily combine multiple datasets and write custom SQL queries to surface any metrics you can think of.
For improved usability, our SQL editor is now embedded into the usual tile editor for a more unified experience, so you can effortlessly click between the two and not lose any progress.
See how we used the SQL editor to build a custom DORA metrics dashboard for DevOps teams here.
Monitoring and notifications
We’ve recently made significant improvements to our monitoring and notification features, which allow you to set custom monitoring thresholds on any tile or data and take instant action with near real-time alerts.
After your valuable feedback, we’ve extended our notification destinations beyond Slack, Teams, ServiceNow and custom webhook, to also include email and any number of external integrations with Zapier.
You can configure a new Zapier Zap directly within your Zapier web portal – see here to learn how.

More context to your notifications
When a metric is out of bounds or the state of a resource has become critical, you now get more context in your notification message with a preview of the tile in question. This is particularly helpful for SLA or cost alerts, as you can now easily see when a resource exceeds a cost threshold.

Flexible notification rules
We’ve also added even more flexibility to our notification rules, which allow you to specify which state changes should trigger a notification. Our recent improvements mean you can now:
- Configure one or more notification rule per workspace
- Trigger to notify on a specific monitor(s), or all monitors
- Route different monitors to different destinations
To see how easy it so is set-up, customize and manage monitors and notifications, watch this short video:
Terraform provider
We’ve put a lot of love into our interface to make use truly effortless. But we also understand that busy teams might want to define SquaredUp resources as code, using the configuration language they use day-in day-out.
That’s why we’ve introduced our new Terraform provider. You can now easily spin up and manage your complete SquaredUp organization – workspaces, data sources, dashboards and more – all without logging in.
Just use JSON to run the commands and see your SquaredUp resources automatically populated in minutes.
Light mode
And finally, we’re thrilled to introduce a brand-new theme, light mode!
By default, the display mode used is decided by your system preferences. But this can be easily changed by clicking Account on the navigation bar and choosing a different option.

Visualizations
As part of our ongoing work to extend and refresh all our visualizations, we've made some major UI enhancements we think you’re going to love.
Live diagrams
We're excited to announce the general availability of our live diagramming feature. With the power of SVG, you can now create live diagrams that display the health state of your environment’s workspaces, dashboards and objects.
Just upload an SVG image from your device (or enter a URL), and if it contains hyperlinks to SquaredUp objects, you’ll have the option to show the health state on the diagram.

Here are a few examples for inspiration:


Other visualization improvements
Expand the sections below to learn about each visualization enhancement we have made.
You can now manually size the text on your dashboard to highlight specific metrics, and when monitoring is enabled, metrics are automatically highlighted based on their health state.

In addition to styling and UI improvements, we’ve increased the customization options of our table visualization by allowing you to choose which columns are hidden or showing and rename them.
When dealing with a high number of columns, you can now ‘hide all’ whilst you’re editing a table, with hidden columns shown at the bottom of the list to improve user experience.

We've given our line graph visualization some love by adding a few highly requested features.
Ticks are displayed much more clearly on the chart axis, making it easier to understand the range being displayed for timeseries data.
You can also now configure your graph to show cumulative data, such as cumulative cost over time, based on daily data points.
And to understand performance at-a-glance, you have the option to add a trend line to your graph, which is calculated using linear regression.

We’ve tweaked our popular Donut visualization to bring it in line with our other visualizations. We now show solid color segments for improved readability, with the total value of all segments shown in the center.
Hover over a segment to highlight the data, and see the value in the center of the donut updated with it.
If you’re using a Donut tile to show state values, you’ll notice it uses a different color palette. The default colors will show red for errors, amber for warnings and green for successes, with unknown states shown in grey.

Following the release of the new organization home, we’ve added further context to your status blocks with the option to include monitor sub-labels. It gives you more information at a glance, so you can quickly understand why your workspace, dashboard or monitor is showing an error or warning. This is the same message you’ll see in our new and improved notification preview.
To see this in action, plus our latest styling and sizing improvements, watch this short video:
One small but mighty change we’ve made to the text tile allows you to preview the text on the right-hand side in the exact aspect ratio it will appear on your dashboard, so you get it exactly how you want it, first time!

Brand new out-of-the-box dashboards
Many of our plugins come with out-of-the-box dashboards that are instantly loaded up with your live data when you add it to your workspace. Expand the sections below to see our latest additions:
The Azure plugin comes with 15 out of the box dashboards that allow you to instantly visualize alerts, databases, VMs and much more.
Of those, eight are entirely dedicated to cost management, giving you full visibility in an instant.
Billing accounts, billing profiles and invoice sections work together to give you a full view of your spend at every level:
Billing Accounts
The billing accounts dashboard provides a high-level view of your total subscription charges, comparing last month’s spend to your current month to date.
Billing profiles
This total spend is broken down further on the billing profiles dashboard, which shows cost per service and location, plus actual vs. amortized spend.
Invoice sections
For even greater detail, head to the invoice sections dashboard to see subscription and transaction breakdowns.
Reservations + Reservation Utilization

The reservations and reservation utilization dashboards work together to help you get the most out of your reserved instances. See your reservation utilization alongside a breakdown of your unused reservation instances. This visibility is the first step to reducing wastage.
Budgets
The budgets dashboard is a helpful way to monitor your actual spend against your allocated budget. If you’re forecasted to exceed your budget, this allows you to take action before you’re charged.
Savings Recommendations
Alongside Budgets, you can use the savings recommendations dashboard, which shows a simple overview of Azure’s recommended savings with reserve instances.
Cost
Finally, the cost dashboard shows a summary of your resource group and subscription spend, with forecasted accumulated cost over time.
To learn more about these dashboards, check out the Dashboard Story.
Once you’ve added the VMware plugin, you’ll now see your virtual machine and host data automatically loaded up in two out-of-the-box dashboards:
Virtual Machines
Instantly view the number of VMs, their health state, unhealthy VMs and a breakdown of virtual machines by version.
Hosts
Visualize the health of your hosts, build versions, alarms plus CPU usage and available memory.
To see how we use the VMware plugin internally to create custom Clusters, Hosts and Guest dashboards, check out our VMware Dashboard Story.
We’ve added two new out-of-the-box Azure DevOps dashboards designed to give you a complete picture of your CI/CD processes at a glance:
Pipelines: Simple Overview

If you rely on ADO for running pipelines and want to see their results, this simple overview dashboard shows top-line build, deployment, and release metrics.
Single Build Pipeline

This dashboard is intended to shine a light on a single, specific build pipeline of your choice.
It will initially use data from the first pipeline it can find from your environment but can easily be customized by editing the tiles and selecting a specific pipeline from the Objects section.
As these dashboards are just a starting point, they can easily be cloned and customized to meet the needs of any team.
To see what other out-of-the-box dashboards you get when you connect to Azure DevOps, check out our Azure DevOps Dashboard Story.
With our AWS plugin, there’s really no limit to what you can visualize, but these six out-of-the-box dashboards are a good place to start.
Get visibility of key health and performance metrics relating to some of the most popular AWS services, proactively spot issues, and setup monitoring to be alerted if any metrics behave in an unexpected way.
API Gateway

This dashboard shows metrics related to number of requests, total data processed, latency, successful API requests, and unsuccessful API requests. These metrics can highlight the performance of API Gateway, and highlight issues related to latency or failed requests.
Elastic Load Balancer

This dashboard shows metrics such as the number of active connections, total processed traffic, unsuccessful requests, and successful requests.
Lambda

This dashboard shows metrics such as Lambda logs, duration, errors, and invocations. These metrics are helpful for understanding the amount of traffic being served by Lambda and could also highlight issues if total number of errors is high.
Route 53

This dashboard gives engineers an understanding of their configured zones, DNS records, and total queries to these zones. It’s helpful as it could highlight busy periods for the application being routed to.
AWS S3

AWS S3 is a popular object storage service. This dashboard highlights any created storage buckets in your AWS environment. In addition, metrics are provided on the number of objects and the total storage size. This is useful as there could be cost implications for a high amount of storage used.
EC2 dashboard

AWS EC2 offers secure and scalable cloud-based compute resource. This allows engineers to create and maintain scalable virtual machines in the cloud. This out-of-the-box SquaredUp dashboard shows the overall health status of your EC2 instances, as well as several key metrics from your instances.
We’re always making product improvements, so to keep up with the latest changes, check out our official changelog. And if there’s a specific plugin you’d like added to the product, you can request it here!
If you want to see any of these updates in more detail, book a demo with our technical team, or create a free account to try the product for yourself.
Happy dashboarding!