Nathan Foreman
Principal Software Engineer

Getting started with SquaredUp is free and easy. Our free tier includes:
This dashboard offers a global view of AWS Lambda invocations within a single account, helping to identify trends that could impact all Lambda functions.
Principal Software Engineer

This dashboard offers a global view of AWS Lambda invocations within a single account, helping to identify trends that could impact all Lambda functions.
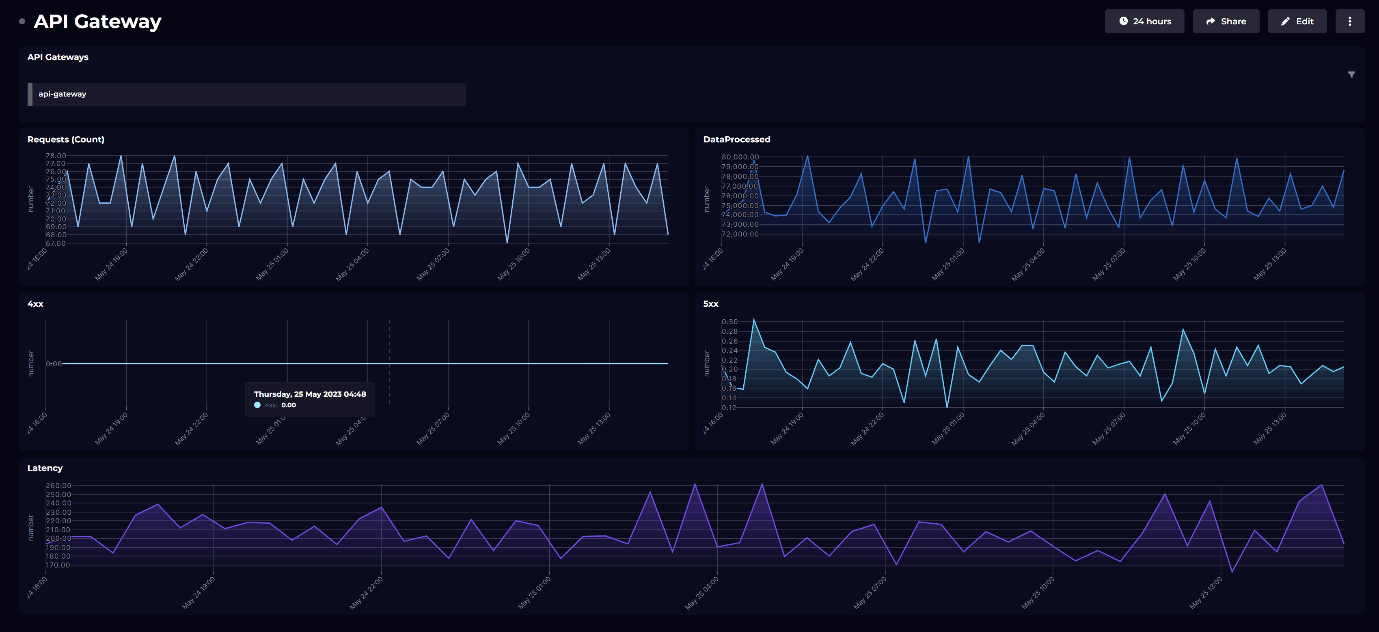
At the top, the dashboard displays total Lambda invocations and the total number of errors for the targeted AWS account, providing immediate insight into overall function performance. Below, the left tile shows instances when Lambda executions were throttled, which could result in user-facing delays. The right tile presents the cumulative time spent running Lambda functions, highlighting any increases that may indicate general slowdowns in processing.
By aggregating activity across numerous Lambdas, it becomes easier to detect overall performance issues or spikes in error counts that might be missed when examining individual functions.
Support teams can leverage this dashboard to quickly pinpoint when and where widespread errors begin, without the need to log into the AWS console—saving time and enhancing efficiency.
This is one of multiple AWS dashboards you get out of the box, so you should be up and running in minutes.
Just hit the toggle to automatically add out-of-the-box dashboards to your workspace, and instantly view your live data.