Blog


We did it! SquaredUp is now a B Corp
It's been a journey - but we're delighted to finally announce our B Corp certification. Here's the story of how it happened...

Top 5 dashboards for DevOps leaders
How DevOps leaders can use SquaredUp to view SLOs and key metrics in a single pane of glass.

Operational Intelligence - the new horizon of observability
The evolution of observability into intelligent, real-time decision-making.

How Evidi built the perfect MSP single pane of glass
Evidi has created the ideal suite of dashboards for MSPs – a customer health overview dashboard that drills into one workspace per customer. Learn more.


Latest blogs
How Evidi built the perfect MSP single pane of glass
Evidi has created the ideal suite of dashboards for MSPs – a customer health overview dashboard that drills into one workspace per customer. Learn more.
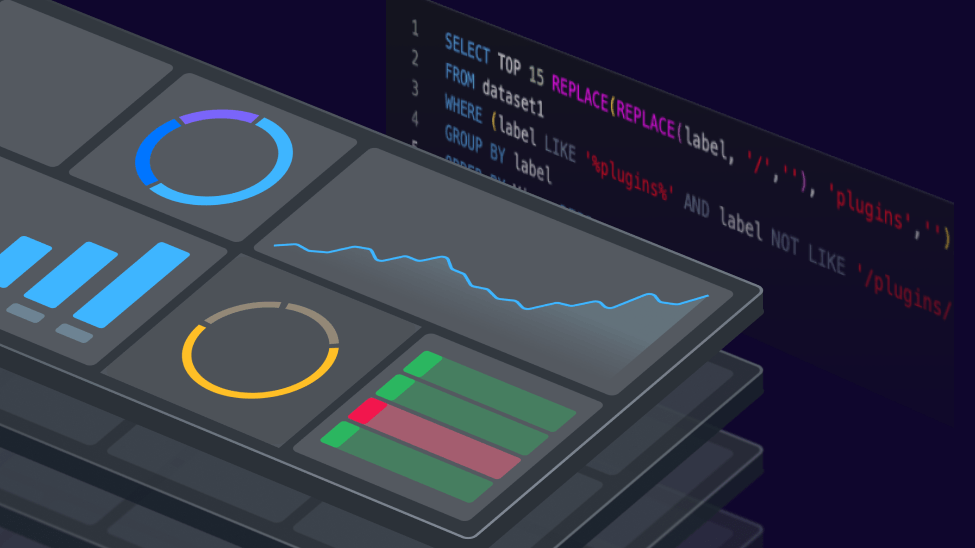
Dashboarding your KQL queries
In this blog we will see how you can easily create beautiful visualizations using Azure KQL queries in SquaredUp.

Getting eyes on your KPIs!
KPI roll-ups in SquaredUp give you high level visibility of KPIs defined throughout every level of your organization.
Rolling your own DevOps metrics
How you can use our Azure DevOps plugin and SQL Analytics feature to easily build the metrics that matter to your team.

Building a better search experience
Our search experience is not only robust and efficient but also deeply integrated with our object-based model, drilldown feature and ethos around collaboration.

SquaredUp Live 2024: A round-up of our virtual customer workshop
Hosting SquaredUp Live was such a blast! A big thank you to the SquaredUp community for showing up to learn, network and exchange insights.

DORA metrics in perspective
DORA metrics have established themselves as a measure of engineering team velocity. However, they must be used intelligently and not as a bureaucratic measure.
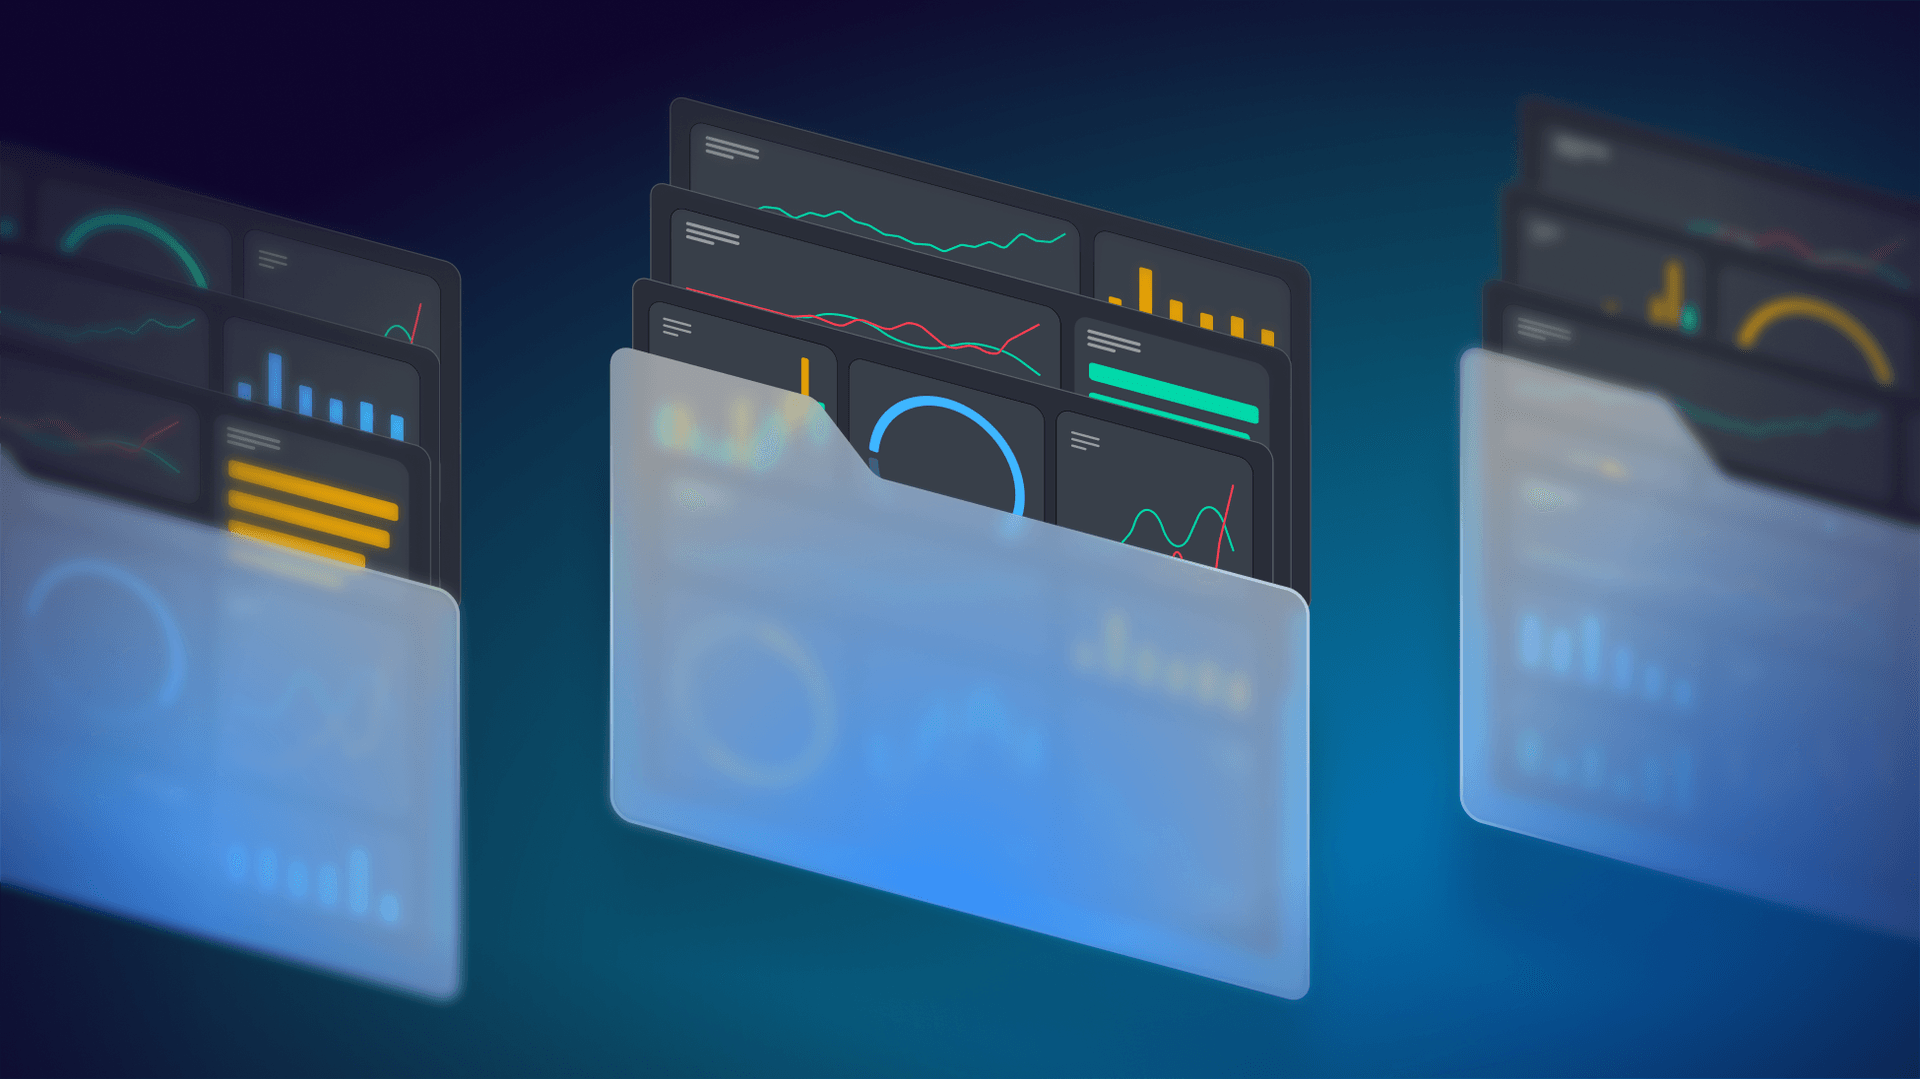
Introducing dashboard folders
We designed dashboard folders to help users stay organized even in large and complex environments. Learn how to use the feature in tandem with workspaces.

Introducing the SquaredUp Cloud Plugin for GripMatix’s Citrix Logon Simulator
Introducing the SquaredUp Cloud Plugin for GripMatix’s Citrix Logon Simulator

Introducing GripMatix Logon Simulator for Citrix
Welcoming the new GripMatix Logon Simulator for Citrix to SquaredUp
Why native Azure DevOps dashboards fall short
Azure DevOps is a powerful CI/CD tool, but many find that its dashboards fall short in terms of flexibility, visualization options and performance. Here's why.

Navigating VMware licensing changes with SquaredUp: Insights from a Global IT service provider
How to navigate the recent license changes to VMware by using the power of SquaredUp. Easily identify key areas of change to optimize cost and license usage.
